Las Playitas Weather & Climate: Best Time to Visit
Temperatures in Las Playitas, Canary Islands, Spain, shift moderately through the seasons. The warmest month is August at 28°C (82°F), and the coolest is January at 21°C (70°F).
With just 84 mm (3.3 in) of annual rainfall, the city has a dry, desert-like climate. July is the sunniest month, averaging 9.9 hours of sunshine per day.
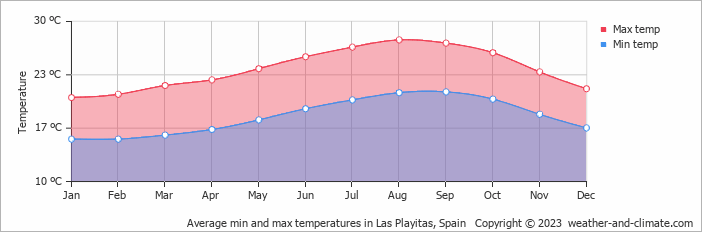
Monthly Temperature in Las Playitas
The weather in Las Playitas changes moderately throughout the year, offering enough variation to appreciate each season. Average daytime temperatures reach a comfortable 28°C (82°F) in August. In January, the coolest month of the year, temperatures drop to a pleasant 21°C (70°F).
At night, temperatures range from around 21°C (70°F) in August to 15°C (59°F) in January.
Check out our detailed temperature page for more information.
Temperature ranges by month
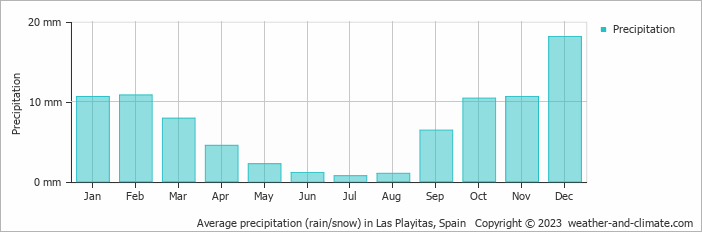
Rainfall in Las Playitas
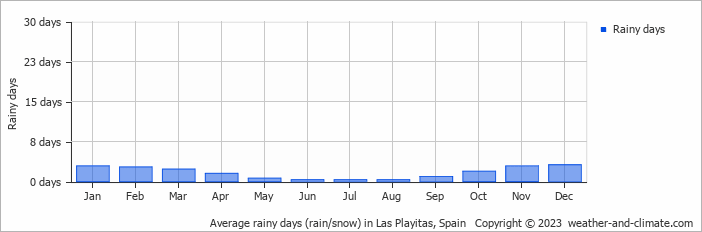
Las Playitas is known for its low rainfall, with yearly precipitation amounts around 84 mm (3.3 in). Las Playitas can be quite wet during December, receiving approximately 18 mm (0.7 in) of precipitation over 3 rainy days.
In contrast, during the driest month (July), you will experience much drier conditions, with 0.7 mm (0.03 in) of precipitation spread across 0 rainy days days. For more details, please visit our Las Playitas Precipitation page.
The mean monthly precipitation over the year, including rain, hail, and snow
The average number of days each month with precipitation
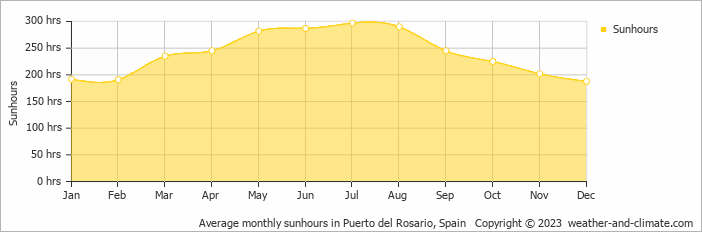
Sunshine Hours in Las Playitas
Las Playitas experiences moderate variation in sunshine hours across the seasons. With 9.9 hours daily sunshine in July, it dips to 6.3 hours in December, offering a balanced mix of sunny and overcast days.
Visit our detailed sunshine hours page for more information.
Monthly hours of sunshine
Daily hours of sunshine
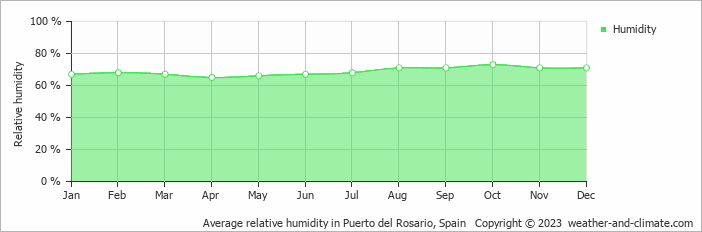
Humidity in Las Playitas by Month
The relative humidity is high throughout the year in Las Playitas.
The city experiences its highest humidity in October, reaching 73%. In April, the humidity drops to its lowest level at 65%. What does this mean? Read our detailed page on humidity levels for further details.
Relative humidity over the year
Las Playitas 3-Day Forecast
Check the conditions for any month of the year.
Best Time to Visit Las Playitas
Las Playitas has a consistent climate, with comfortable temperatures from 21°C (69°F) to 28°C (82°F) maintained throughout the entire year. The arid conditions provide endless sunny days with minimal weather variation.Whether you visit in any month, you'll experience the same reliably pleasant weather. This makes it perfect for flexible travel planning. Planning your next adventure but unsure where to go? Our climate tool suggests perfect locations tailored to your preferred weather conditions. Discover your ideal travel destination with our weather planner.


