La Palmilla Weather & Climate: Best Time to Visit
La Palmilla, Colombia, has a stable climate with little temperature variation across the year. Average daytime temperatures hover around 25°C (77°F), peaking in January at 25°C (77°F) and dipping in September to 25°C (77°F).
The city receives considerable rainfall, with around 12500 mm (492 in) annually. July is the wettest month.
Monthly Temperature in La Palmilla
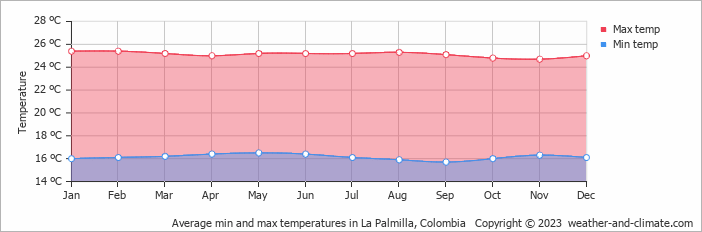
With minimal seasonal shifts, La Palmilla experiences a constant climate year-round. Typically, average maximum daytime temperatures range from a comfortable 25°C (77°F) in January to a comfortable 25°C (77°F) in the coolest month, September.
Nights vary from 17°C (63°F) in January to around 16°C (61°F) during the colder months.
Check out our detailed temperature page for more information.
Temperature ranges by month
Rainfall in La Palmilla
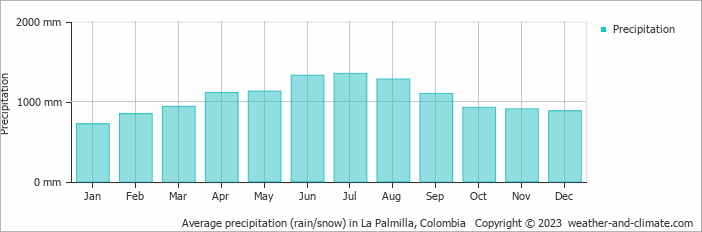
La Palmilla has a notably wet climate with abundant precipitation, recording 12500 mm (492 in) of rainfall per year. La Palmilla offers a pleasant mix of wetter and slightly drier months. The difference in precipitation between the wettest month July (1349 mm (53 in)) and the driest month January (719 mm (28 in)) is not too significant. For more details, please visit our La Palmilla Precipitation page.
The mean monthly precipitation over the year, including rain, hail, and snow
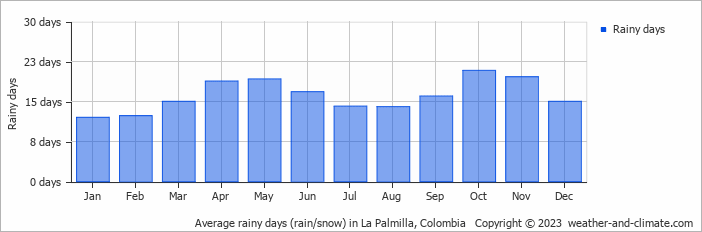
The average number of days each month with precipitation
La Palmilla 3-Day Forecast
Check the conditions for any month of the year.
Best Time to Visit La Palmilla
La Palmilla has a consistently rainy climate year-round, with every month experiencing heavy precipitation exceeding 160 mm (6.3 in). There is no traditional dry season to recommend for visits. January stands out as the least wet month with 719 mm (28 in) of rainfall.Plan your visit with the expectation of frequent rain and pack accordingly. The year-round moisture creates beautiful green surroundings, but requires waterproof preparation. Planning your next adventure but unsure where to go? Our climate tool suggests perfect locations tailored to your preferred weather conditions. Discover your ideal travel destination with our weather planner.


