La Caldera Weather & Climate: Best Time to Visit
Average temperatures, rainfall, sunshine and the best time to visit La Caldera.
Climate overview of La Caldera
La Caldera, Salta Province, Argentina, experiences moderate temperature changes through the seasons. January is the warmest month with daytime highs of 24°C (75°F), while July is the coolest at 17°C (63°F).
Rainfall is high, totalling around 2473 mm (97 in) per year. February is the wettest month and July the driest. The city also experiences a distinct rainy season from October to April. The sunniest month is August, with 6.9 hours of sunshine per day on average.
La Caldera Weather by Month
Pick a month to see the average temperature, rainfall and sunshine in La Caldera — and find the best time to visit.
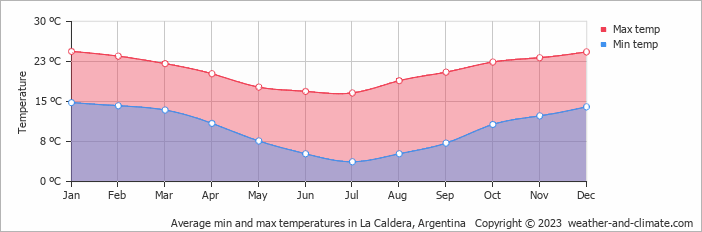
Monthly Temperature in La Caldera
The climate in La Caldera experiences moderate temperature changes, with mild shifts between seasons. Average maximum daytime temperatures range from a comfortable 24°C (75°F) in January, the warmest time of the year, to a moderate 17°C (63°F) during cooler months like July.
At night, you can expect temperatures ranging from 15°C (59°F) in January to around 4°C (39°F) during July.
Check out our detailed temperature page for more information.
Temperature ranges by month
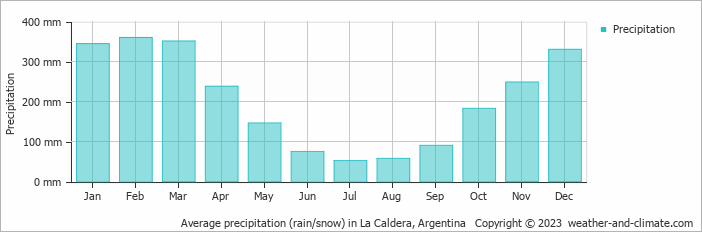
Rainfall in La Caldera
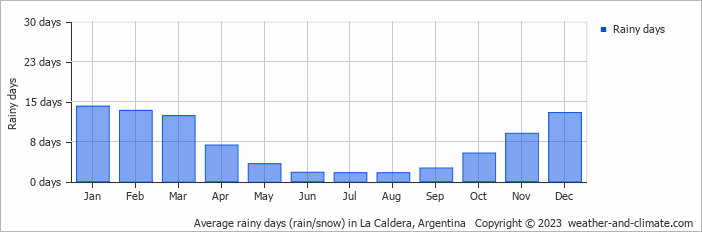
La Caldera has a relatively rainy climate with high precipitation levels, averaging 2473 mm (97 in) of rainfall annually. Significant seasonal changes in precipitation occur throughout the year. In the wettest month, February it receives heavy rainfall, averaging 360 mm (14 in) of precipitation, recorded across 13 rainy days. In contrast, the driest month July brings less rainfall, with 52 mm (2 in) over 2 rainy days. For more details, please visit our La Caldera Precipitation page.
The mean monthly precipitation over the year, including rain, hail, and snow
The average number of days each month with precipitation
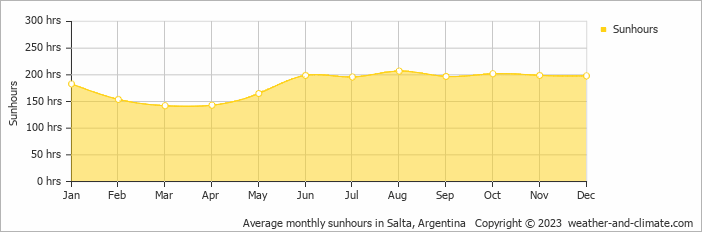
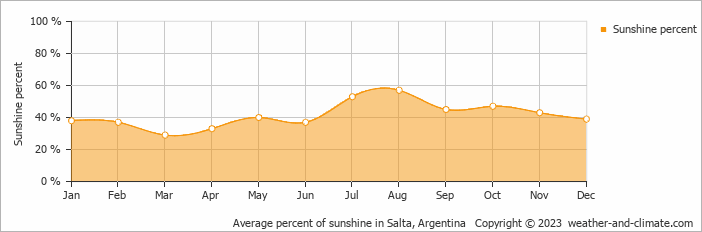
Sunshine Hours in La Caldera
While the amount of sunshine in La Caldera varies throughout the year, all seasons offer their own charm. Enjoy up to 6.9 hours of daily sun in August, and experience slightly darker atmosphere in March, with about 4.7 hours of daily sunlight.
Visit our detailed sunshine hours page for more information.
Monthly hours of sunshine
Daily hours of sunshine
Daily percentage of sunshine
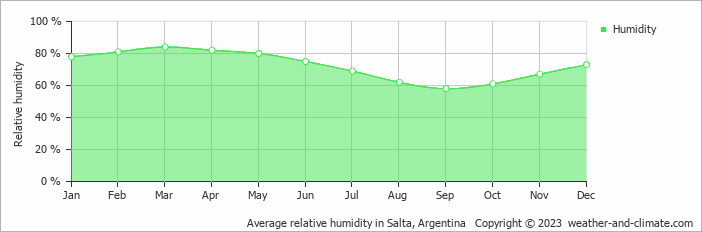
Humidity in La Caldera by Month
The relative humidity is high throughout the year in La Caldera.
The city experiences its highest humidity in March, reaching 84%. In September, the humidity drops to its lowest level at 58%. What does this mean? Read our detailed page on humidity levels for further details.
Relative humidity over the year
Best Time to Visit La Caldera
Rainfall during this time ranges from 52 mm (2 in) in July to 146 mm (5.7 in) in May. This means you can expect a mix of sunny days and occasional showers.
The rainy season falls during January, February, March, April, October, November and December, bringing heavy precipitation. Looking for inspiration on where to travel this year? We have a tool that recommends destinations based on your ideal conditions. Find out where to go with our weather planner.
Frequently asked questions about the climate in La Caldera
What is the best time to visit La Caldera?
September typically offers the most optimal weather in La Caldera. In contrast, January, February, March and December tend to have less optimal conditions. La Caldera has a distinct rainy season from October to April.
What temperatures can I expect in La Caldera?
Daytime highs range from 17°C (63°F) in July to 24°C (75°F) in January. Nighttime lows range from 4°C (39°F) to 15°C (59°F).
How much rain does La Caldera get?
Annual rainfall is around 2473 mm (97 in). February is the wettest month with 360 mm (14 in), while July is the driest with 52 mm (2 in).
How sunny is La Caldera?
La Caldera receives around 2,185 hours of sunshine per year. August is the sunniest month with 207 hours, while March is the cloudiest with just 142 hours. Overall, La Caldera enjoys abundant sunshine.
La Caldera 3-Day Forecast
La Caldera 3-Day Forecast
La Caldera on the map
La Caldera is highlighted — select any city to see its climate.
Popular this month
Where to go in July — average daytime high across popular destinations.
Bucket list
Need travel inspiration? Check out our bucket list articles and be inspired.
 The 10 most alternative cities in South America
Discover South America's top 10 alternative cities! From Valparaíso's vibrant streets to La Paz's high-altitude charm and Medellín's innovative spirit.
Be amazed by Buenos Aires
The city of beautiful museums, cute streets, green parks, lots of good food, interesting local neighborhoods and impressive historical buildings.
Explore Patagonia
A tour through Patagonia brings you to the end of the world. That’s why Patagonia is a bucket list destination for many. We recommend to visit Patagonia from November to early March.
Glacier walk on The Perito Moreno glacier
The Perito Moreno glacier and the rupture of this glacier is considered one of the most impressive natural spectacles in the world. You can wait here until a large piece of ice crumbles and plunges into the water with a lot of noise.