Krzywaczka Weather & Climate: Best Time to Visit
Average temperatures, rainfall, sunshine and the best time to visit Krzywaczka.
Climate overview of Krzywaczka
Krzywaczka, Lesser Poland, Poland, experiences significant temperature variation throughout the year. Summers bring daytime highs of 25°C (77°F) in August, while winters cool to 2°C (36°F) in January.
Krzywaczka sees a moderate amount of rain/snowfall, totalling around 985 mm (39 in) per year. July is the sunniest month, averaging 6.8 hours of sunshine per day.
Krzywaczka Weather by Month
Pick a month to see the average temperature, rainfall and sunshine in Krzywaczka — and find the best time to visit.
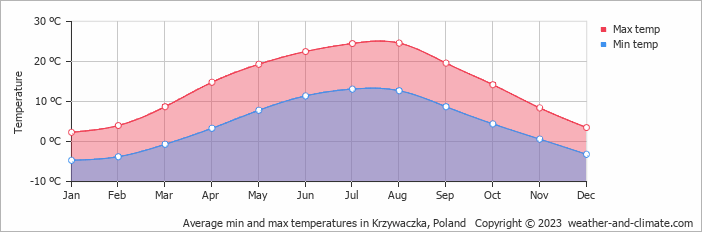
Monthly Temperature in Krzywaczka
Depending on the time of the year, temperatures range from comfortable to chilly in Krzywaczka. Average maximum daytime temperatures range from a comfortable 25°C (77°F) in August, the warmest time of the year, to a chilly 2°C (36°F) during cooler months like January.
At night, you can expect temperatures ranging from 13°C (55°F) in August to around -5°C (23°F) during January.
Check out our detailed temperature page for more information.
Temperature ranges by month
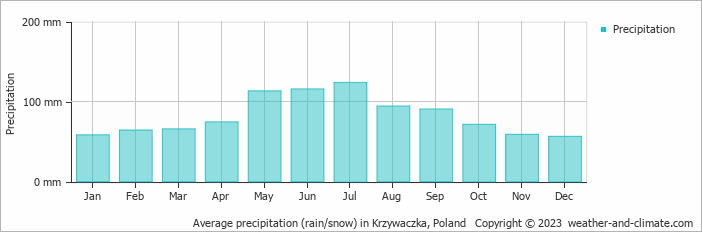
Rainfall in Krzywaczka
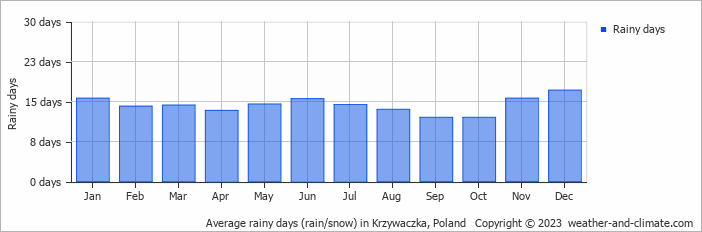
Generally, Krzywaczka has a moderate amount of precipitation, averaging 985 mm (39 in) of rain/snowfall annually. Significant seasonal changes in precipitation occur throughout the year. In the wettest month, July it receives high rainfall, averaging 124 mm (4.9 in) of precipitation, recorded across 14 rainy days. In contrast, the driest month December brings less snow/rainfall, with 56 mm (2.2 in) over 17 snowy/rainy days. For more details, please visit our Krzywaczka Precipitation page.
The mean monthly precipitation over the year, including rain, hail, and snow
The average number of days each month with precipitation
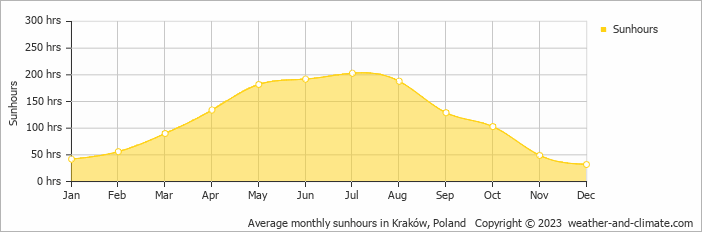
Sunshine Hours in Krzywaczka
Seasonal changes in sunshine hours are quite dramatic in Krzywaczka. While July receives considerable daily sunshine with up to 6.8 hours, December marks the darkest time of the year, where sunshine is scarce with only 1.1 hours of sunlight per day.
Visit our detailed sunshine hours page for more information.
Monthly hours of sunshine
Daily hours of sunshine
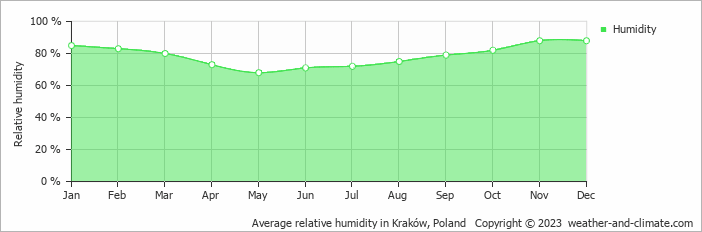
Humidity in Krzywaczka by Month
The relative humidity is high throughout the year in Krzywaczka.
The city experiences its highest humidity in November, reaching 88%. In May, the humidity drops to its lowest level at 68%. What does this mean? Read our detailed page on humidity levels for further details.
Relative humidity over the year
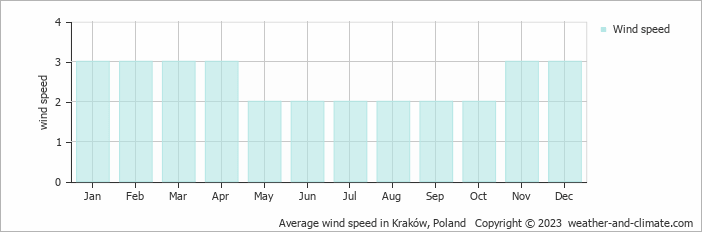
Wind Speed in Krzywaczka
The mean wind speed over the year ranges from 2 m/s (4 knots) in May, June, July, August, September and October to 3 m/s (6 knots) in January, February, March, April, November and December. What does this mean?
The mean monthly wind speed over the year (meters per second)
Best Time to Visit Krzywaczka
Rainfall during this time ranges from 90 mm (3.5 in) in September to 124 mm (4.9 in) in July. This means you can expect a mix of sunny days and occasional showers. Looking for inspiration on where to travel this year? We have a tool that recommends destinations based on your ideal conditions. Find out where to go with our weather planner.
Frequently asked questions about the climate in Krzywaczka
What is the best time to visit Krzywaczka?
August and September typically offer the most optimal weather in Krzywaczka. In contrast, January, February, March, November and December tend to have less optimal conditions.
What temperatures can I expect in Krzywaczka?
Daytime highs range from 2°C (36°F) in January to 25°C (77°F) in August. Nighttime lows range from -5°C (23°F) to 13°C (55°F). Temperatures vary considerably through the year.
How much rain does Krzywaczka get?
Annual rainfall is around 985 mm (39 in). July is the wettest month with 124 mm (4.9 in), while December is the driest with 56 mm (2.2 in).
How sunny is Krzywaczka?
Krzywaczka receives around 1,400 hours of sunshine per year. July is the sunniest month with 203 hours, while December is the cloudiest with just 32 hours.
Krzywaczka 3-Day Forecast
Krzywaczka 3-Day Forecast
Krzywaczka on the map
Krzywaczka is highlighted — select any city to see its climate.
Popular this month
Where to go in July — average daytime high across popular destinations.
Bucket list
Need travel inspiration? Check out our bucket list articles and be inspired.
 7 of the most budget-friendly destinations in Europe
Discover Europe's top budget-friendly destinations including Budapest, Kotor, Krakow, and more, perfect for affordable and exciting travel.
 Bialowieza, the Last Primeval Forest
Being the last remaining segment of the once sprawling lowland forest that covered Europe, Bialowieza stands as the final stronghold of true wilderness on the continent.