Kindberg Weather & Climate: Best Time to Visit
Average temperatures, rainfall, sunshine and the best time to visit Kindberg.
Climate overview of Kindberg
Kindberg, Styria, Austria, experiences significant temperature variation throughout the year. Summers bring daytime highs of 22°C (72°F) in July, while winters cool to 1°C (34°F) in January.
The city receives considerable rain/snowfall, with around 1223 mm (48 in) annually. June is the wettest month. The most sunshine falls in July, with an average of 6.7 hours of daily sunshine.
Kindberg Weather by Month
Pick a month to see the average temperature, rainfall and sunshine in Kindberg — and find the best time to visit.
Monthly Temperature in Kindberg
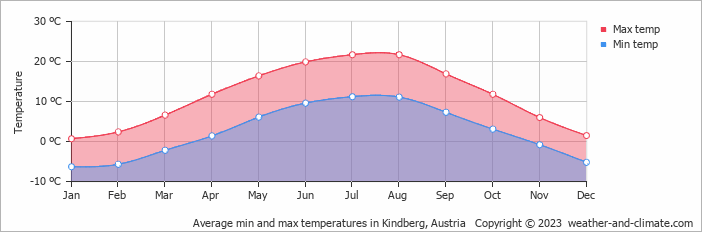
Depending on the time of the year, temperatures range from pleasant to very cold in Kindberg. Typically, average maximum daytime temperatures range from a pleasant 22°C (72°F) in July to a very cold 1°C (34°F) in the coolest month, January.
Nights vary from 11°C (52°F) in July to around -6°C (21°F) during the colder months.
Check out our detailed temperature page for more information.
Temperature ranges by month
Rainfall in Kindberg
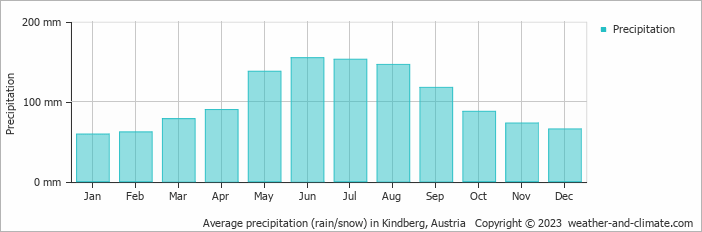
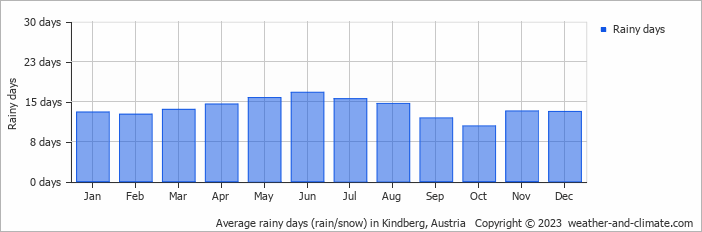
Kindberg has a relatively rain/snowy climate with high precipitation levels, averaging 1223 mm (48 in) of rain/snowfall annually. The climate in Kindberg shows significant variation throughout the year. Expect high rainfall in June, the wettest month, with an average of 155 mm (6.1 in) of precipitation over 17 rainy days.
In contrast, the driest month January offers drier and sunnier days, with around 59 mm (2.3 in) of snowfall over 13 snowy days. For more details, please visit our Kindberg Precipitation page.
The mean monthly precipitation over the year, including rain, hail, and snow
The average number of days each month with precipitation
Sunshine Hours in Kindberg
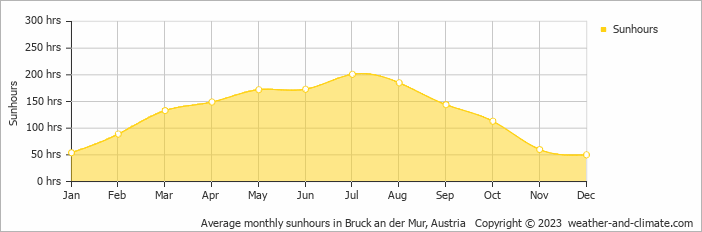
For those who appreciate different seasons, Kindberg serves as an ideal destination. Expect longer, more sun-filled days in July with an average of 6.7 hours of sunshine daily, and embrace the darker days in December, offering only 1.7 hours of daily sunlight.
Visit our detailed sunshine hours page for more information.
Monthly hours of sunshine
Daily hours of sunshine
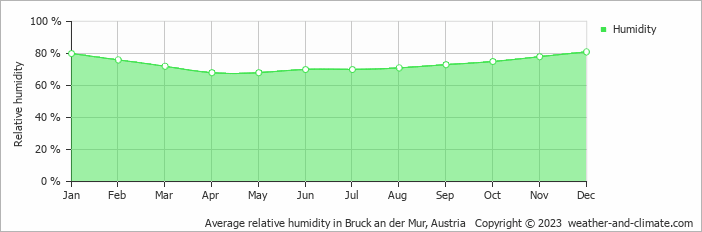
Humidity in Kindberg by Month
The relative humidity is high throughout the year in Kindberg.
The city experiences its highest humidity in December, reaching 81%. In April, the humidity drops to its lowest level at 68%. What does this mean? Read our detailed page on humidity levels for further details.
Relative humidity over the year
Best Time to Visit Kindberg
Rainfall during this time ranges from 117 mm (4.6 in) in September to 155 mm (6.1 in) in June. This means you can expect a mix of sunny days and occasional showers. Wondering where to travel based on your weather preferences? Our recommendation tool helps you find destinations with your ideal climate conditions. Use our weather planner to find your perfect destination.
Frequently asked questions about the climate in Kindberg
What is the best time to visit Kindberg?
June, July and August typically offer the most optimal weather in Kindberg. In contrast, January, February, March, November and December tend to have less optimal conditions.
What temperatures can I expect in Kindberg?
Daytime highs range from 1°C (34°F) in January to 22°C (72°F) in July. Nighttime lows range from -6°C (21°F) to 11°C (52°F). Temperatures vary considerably through the year.
How much rain does Kindberg get?
Annual rainfall is around 1223 mm (48 in). June is the wettest month with 155 mm (6.1 in), while January is the driest with 59 mm (2.3 in).
How sunny is Kindberg?
Kindberg receives around 1,523 hours of sunshine per year. July is the sunniest month with 201 hours, while December is the cloudiest with just 50 hours.
Kindberg 3-Day Forecast
Kindberg 3-Day Forecast
Kindberg on the map
Kindberg is highlighted — select any city to see its climate.
Popular this month
Where to go in June — average daytime high across popular destinations.
Bucket list
Need travel inspiration? Check out our bucket list articles and be inspired.
 Ski Arlberg is the snow mecca of the Alps
Ski Arlberg is one of the most extensive and snow-sure ski resorts in Austria. In this area you will find challenging slopes, bustling après-ski and a combination of sporty and traditional villages.
Snowbombing Festival in Austria
Snowbombing Festival in Austria. Imagine that you can combine your favorite festival with all the benefits of a winter sports holiday.
Cycle the Danube trail
The Danube cycle route is one of the most popular cycling routes in Europe, and rightly so, because it is a varied route that is interesting both in terms of culture and nature.