Kerman Weather & Climate: Best Time to Visit
Average temperatures, rainfall, sunshine and the best time to visit Kerman.
Climate overview of Kerman
Kerman, Iran, experiences significant temperature variation throughout the year. Summers bring daytime highs of 35°C (95°F) in July, while winters cool to 12°C (54°F) in January.
The area sees almost no rain/snowfall, totalling just 138 mm (5.4 in) per year. The most sunshine falls in July, with an average of 11.3 hours of daily sunshine.
Kerman Weather by Month
Pick a month to see the average temperature, rainfall and sunshine in Kerman - and find the best time to visit.
Monthly Temperature in Kerman
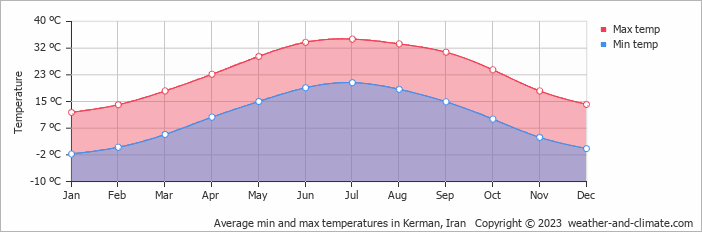
Depending on the time of the year, temperatures range from very warm to chilly in Kerman. Typically, average maximum daytime temperatures range from a very warm 35°C (95°F) in July to a chilly 12°C (54°F) in the coolest month, January.
Nights vary from 21°C (70°F) in July to around -1°C (30°F) during the colder months.
Check out our detailed temperature page for more information.
Temperature ranges by month
Rainfall in Kerman
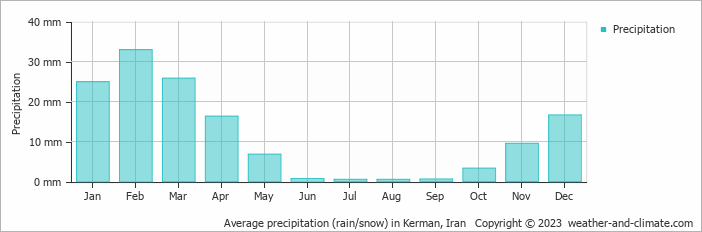
Kerman has a dry climate with very low precipitation, averaging 138 mm (5.4 in) of rain/snowfall annually. The climate in Kerman shows significant variation throughout the year. Expect moderate rainfall in February, the wettest month, with an average of 33 mm (1.3 in) of precipitation over 6 rainy days.
In contrast, the driest month July offers drier and sunnier days, with around 0.5 mm (0.02 in) of rainfall over a single rainy day. For more details, please visit our Kerman Precipitation page.
The mean monthly precipitation over the year, including rain, hail, and snow
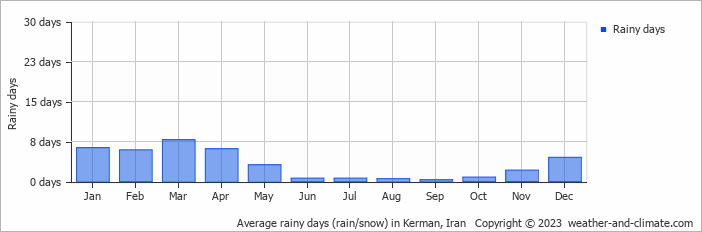
The average number of days each month with precipitation
Sunshine Hours in Kerman
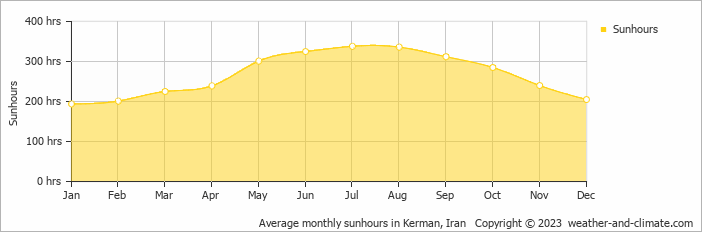
For those who appreciate different seasons, Kerman serves as an ideal destination. Expect longer, more sun-filled days in July with an average of 11.3 hours of sunshine daily, and embrace the darker days in January, offering only 6.5 hours of daily sunlight.
Visit our detailed sunshine hours page for more information.
Monthly hours of sunshine
Daily hours of sunshine
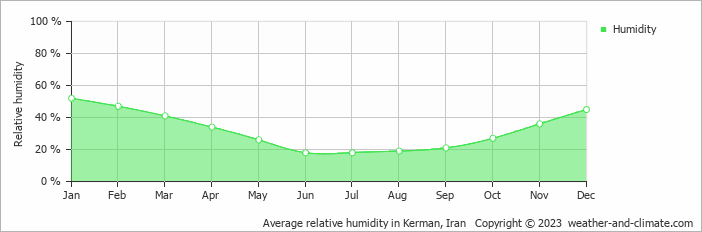
Humidity in Kerman by Month
The relative humidity is low throughout the year in Kerman.
The city experiences its highest humidity in January, reaching 52%. In June, the humidity drops to its lowest level at 18%. What does this mean? Read our detailed page on humidity levels for further details.
Relative humidity over the year
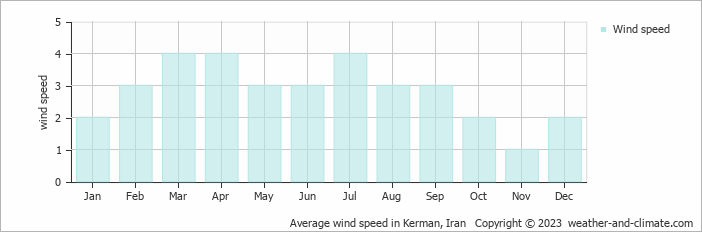
Wind Speed in Kerman
The mean wind speed over the year ranges from 1 m/s (2 knots) in November to 4 m/s (8 knots) in March, April and July. What does this mean?
The mean monthly wind speed over the year (meters per second)
Best Time to Visit Kerman
Monthly ratings reflect general weather comfort, based on daytime temperature and rainfall. Swimming and winter conditions are highlighted separately where relevant.
- Best overall: March, April, May, October and November
- Warmest weather: June, July and August
- Most sunshine: June, July and August
- Seasonal pattern: Very little rainfall year-round, with very warm summers and cold winters
- Coldest conditions: January, with freezing nights around -1°C (30°F).
Frequently asked questions about the climate in Kerman
What is the best time to visit Kerman?
March, April, May, October and November typically offer the most optimal weather in Kerman. In contrast, June and July tend to have less optimal conditions. Kerman has very little rainfall year-round, with very warm summers and cold winters.
What temperatures can I expect in Kerman?
Daytime highs range from 12°C (54°F) in January to 35°C (95°F) in July. Nighttime lows range from -1°C (30°F) to 21°C (70°F). Temperatures vary considerably through the year.
How much rain does Kerman get?
Annual rainfall is around 138 mm (5.4 in). February is the wettest month with 33 mm (1.3 in), while July is the driest with 0.5 mm (0.02 in).
How sunny is Kerman?
Kerman receives around 3,201 hours of sunshine per year. July is the sunniest month with 338 hours, while January is the cloudiest with just 194 hours. Overall, Kerman enjoys abundant sunshine.
Kerman 3-Day Forecast
Kerman 3-Day Forecast
Kerman on the map
Kerman is highlighted - select any city to see its climate.
Popular this month
Where to go in July - average daytime high across popular destinations.
Bucket list
Need travel inspiration? Check out our bucket list articles and be inspired.
 10 Hidden gems in Asia you need to visit
Explore 10 hidden gems in Asia offering authentic experiences, from pristine beaches and remote islands to cultural treks and peaceful mountain villages.
 Ski the Alborz mountains
There is a lot of snow from late November until early April and it’s almost never too cold. Skiing the Alborz mountain in Iran is something for the bucket list for sure.