















 Gorilla tracking in Uganda
Gorillas and people walk the same paths in Bwindi Impenetrable National Park in Uganda. It is a bucket list experience you will never forget.
Average temperatures, rainfall, sunshine and the best time to visit Jinja.
 –
–
Jinja, in Uganda's Eastern region, maintains a steady average temperature throughout the year with consistent conditions. The area is known for receiving heavy rainfall spread across the seasons, with distinct wet and dry periods. People come to Jinja to visit the source of the Nile River and experience world-class whitewater rafting on the powerful rapids below the dam. Let's explore the climate details to provide you with a complete overview on when to visit.
Pick a month to see the average temperature, rainfall and sunshine in Jinja - and find the best time to visit.
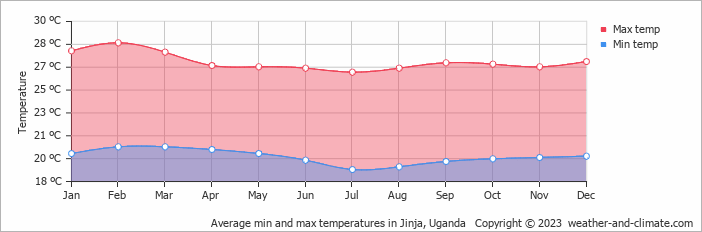
With minimal seasonal shifts, Jinja experiences a constant climate year-round. Typically, average maximum daytime temperatures range from a comfortable 28°C (82°F) in February to a comfortable 26°C (79°F) in the coolest month, July.
Nights vary from 21°C (70°F) in February to around 19°C (66°F) during the colder months.
Check out our detailed temperature page for more information.
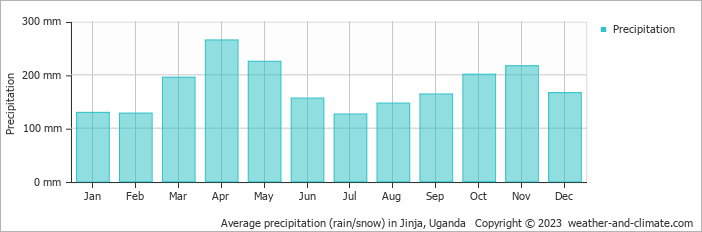
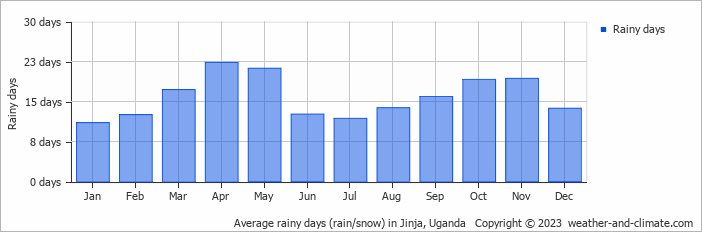
Jinja has a notably wet climate with abundant precipitation, recording 2119 mm (83 in) of rainfall per year. Jinja offers a pleasant mix of wetter and slightly drier months. The difference in precipitation between the wettest month April (265 mm (10 in)) and the driest month July (126 mm (5 in)) is not too significant. For more details, please visit our Jinja Precipitation page.
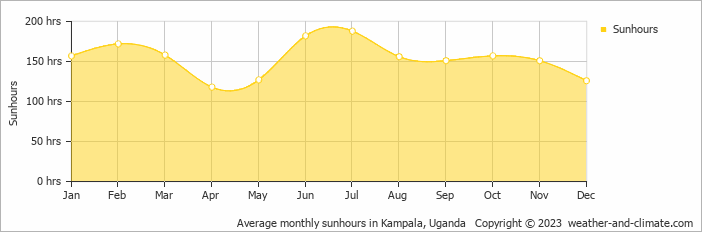
Jinja offers a pleasant mix of sunny and slightly overcast days. The difference in sunshine hours between July (6.3 hours daily) and April (3.9 hours daily) provides a bit of variety for visitors and residents.
Visit our detailed sunshine hours page for more information.
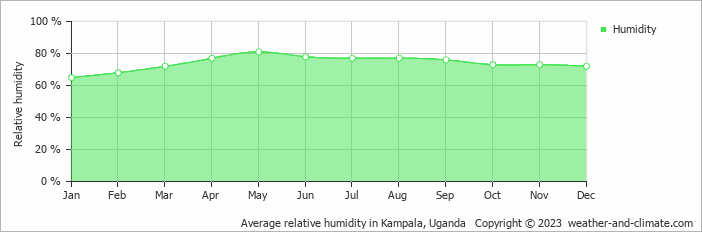
The relative humidity is high throughout the year in Jinja.
The city experiences its highest humidity in May, reaching 81%. In January, the humidity drops to its lowest level at 65%. What does this mean? Read our detailed page on humidity levels for further details.
Monthly ratings reflect general weather comfort, based on daytime temperature and rainfall. Swimming and winter conditions are highlighted separately where relevant.
January, February, June, July, August, September and December typically offer the most optimal weather in Jinja. In contrast, April tends to have less optimal conditions. Jinja has a distinct rainy season from March to May.
Daytime highs range from 26°C (79°F) in July to 28°C (82°F) in February. Nighttime lows range from 19°C (66°F) to 21°C (70°F). Temperatures stay relatively stable year-round.
Annual rainfall is around 2119 mm (83 in). April is the wettest month with 265 mm (10 in), while July is the driest with 126 mm (5 in).
Jinja receives around 1,843 hours of sunshine per year. July is the sunniest month with 188 hours, while April is the cloudiest with just 118 hours.
Jinja is highlighted - select any city to see its climate.
Where to go in October - average daytime high across popular destinations.
Gulu 30°C (86°F) Mbarara
 27°C (81°F) Jinja27°C (81°F) Masaka27°C (81°F) Kampala26°C (79°F) Lyamutundwe26°C (79°F) Entebbe26°C (79°F) Kabale24°C (75°F)
 Need travel inspiration? Check out our bucket list articles and be inspired.
Gorilla tracking in Uganda
Gorillas and people walk the same paths in Bwindi Impenetrable National Park in Uganda. It is a bucket list experience you will never forget.
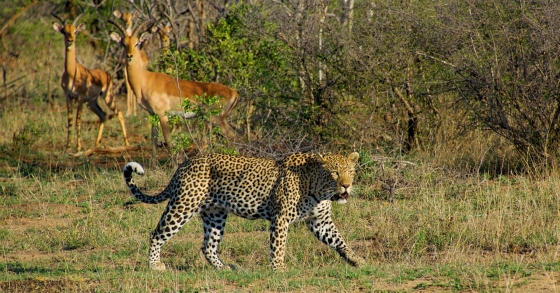
 Visit Kruger Park in South Africa
Are you going to South Africa, then you cannot skip the Kruger Park. The Kruger Park is one of the most beautiful and largest safari parks in the world.
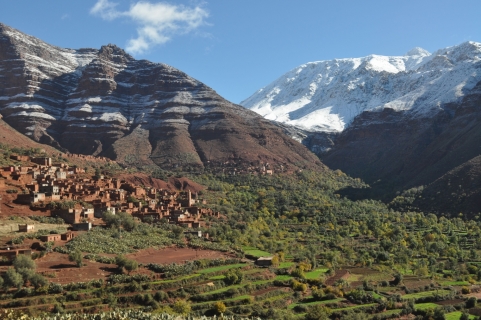
 The Atlas Mountains in Morocco
This mountain range is the second highest mountains in the world and is certainly one of the most natural and wonderful mountains you could ever visit. One for the bucket list for sure.
 One of South Africa's most spectacular private game reserves
Sabi Sand Game Reserve is one of South Africa's most spectacular private game reserves. The chance that you see the entire Big Five is high in winter (June - August).