Hurup Weather & Climate: Best Time to Visit
Average temperatures, rainfall, sunshine and the best time to visit Hurup.
Climate overview of Hurup
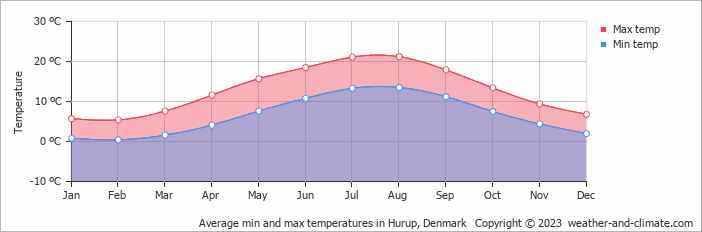
Temperatures in Hurup, Nordjylland, Denmark, vary greatly throughout the year. August is the hottest month at 21°C (70°F), while February is the coldest at 5°C (41°F).
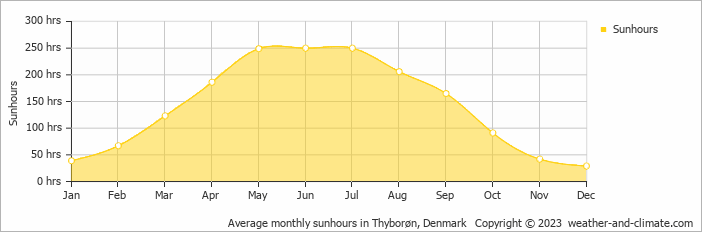
Hurup sees a moderate amount of rain/snowfall, totalling around 870 mm (34 in) per year. The sunniest month is June, with 8.3 hours of sunshine per day on average.
Hurup Weather by Month
Pick a month to see the average temperature, rainfall and sunshine in Hurup — and find the best time to visit.
Monthly Temperature in Hurup
The climate in Hurup is known for significant temperature differences throughout the year, making the weather dynamic. Average maximum daytime temperatures range from a pleasant 21°C (70°F) in August, the warmest time of the year, to a chilly 5°C (41°F) during cooler months like February.
At night, you can expect temperatures ranging from 14°C (57°F) in August to around 0°C (32°F) during February.
Check out our detailed temperature page for more information.
Temperature ranges by month
Rainfall in Hurup
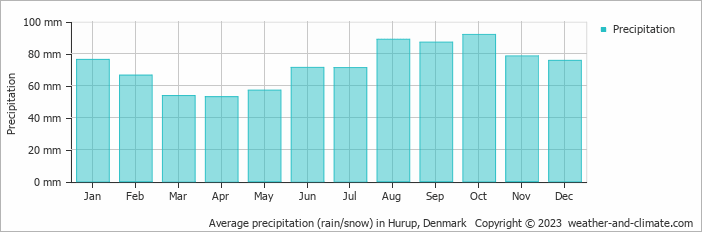
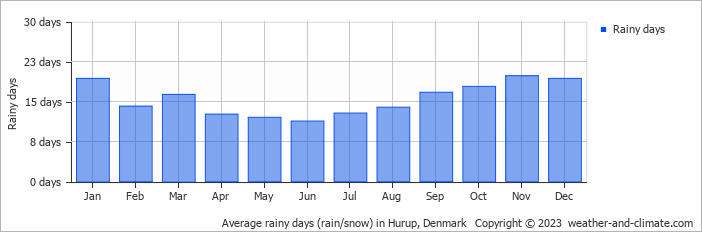
Generally, Hurup receives mid-range precipitation levels, with 870 mm (34 in) annually. While rainfall varies throughout the year, each season offers its own charm. October brings wetter days averaging 92 mm (3.6 in) of precipitation, spread over 18 rainy days.
In contrast, the driest month April experiences a drier climate, with about 53 mm (2.1 in) of rainfall spread across 13 rainy days. For more details, please visit our Hurup Precipitation page.
The mean monthly precipitation over the year, including rain, hail, and snow
The average number of days each month with precipitation
Sunshine Hours in Hurup
Seasonal changes in sunshine hours are quite dramatic in Hurup. While June receives considerable daily sunshine with up to 8.3 hours, December marks the darkest time of the year, where sunshine is scarce with only 1.0 hours of sunlight per day.
Visit our detailed sunshine hours page for more information.
Monthly hours of sunshine
Daily hours of sunshine
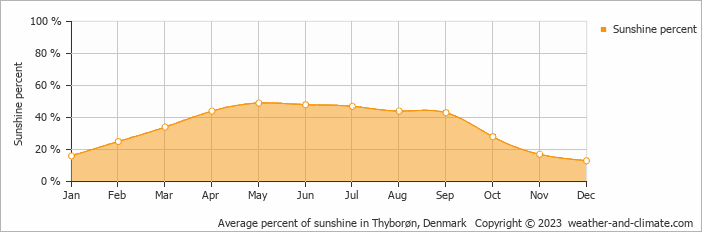
Daily percentage of sunshine
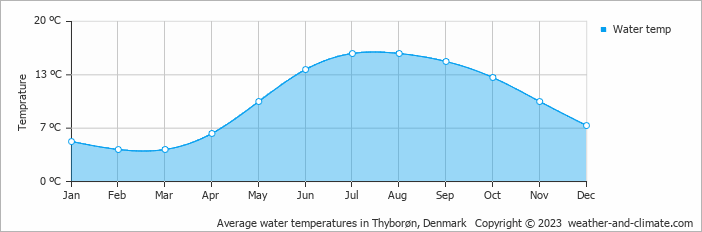
Water Temperature in Hurup
The mean water temperature over the year ranges from 4°C (39°F) in February to 16°C (61°F) in July.
Water temperature over the year
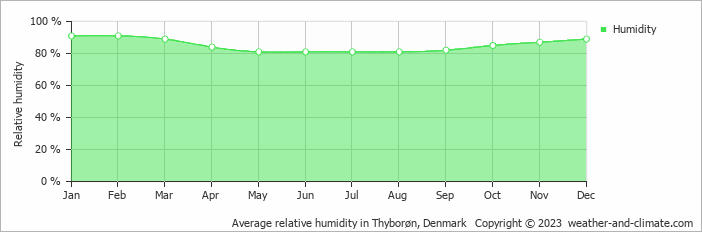
Humidity in Hurup by Month
The city experiences its highest humidity in January, reaching 91%. In May, the humidity drops to its lowest level at 81%. What does this mean? Read our detailed page on humidity levels for further details.
Relative humidity over the year
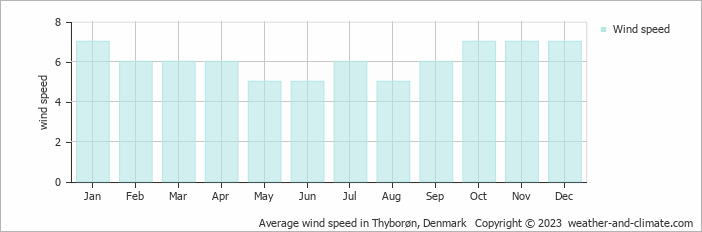
Wind Speed in Hurup
The average wind speed over the year ranges from 5 m/s (10 knots) to 7 m/s (14 knots). It is lower in May, June and August and higher in January, October, November and December. What does this mean?
The mean monthly wind speed over the year (meters per second)
Best Time to Visit Hurup
Frequently asked questions about the climate in Hurup
What is the best time to visit Hurup?
July and August typically offer the most optimal weather in Hurup. In contrast, January, February, March, November and December tend to have less optimal conditions.
What temperatures can I expect in Hurup?
Daytime highs range from 5°C (41°F) in February to 21°C (70°F) in August. Nighttime lows range from 0°C (32°F) to 14°C (57°F). Temperatures vary considerably through the year.
How much rain does Hurup get?
Annual rainfall is around 870 mm (34 in). October is the wettest month with 92 mm (3.6 in), while April is the driest with 53 mm (2.1 in).
How sunny is Hurup?
Hurup receives around 1,697 hours of sunshine per year. June is the sunniest month with 250 hours, while December is the cloudiest with just 29 hours.
Hurup 3-Day Forecast
Hurup 3-Day Forecast
Hurup on the map
Hurup is highlighted — select any city to see its climate.
Popular this month
Where to go in July — average daytime high across popular destinations.