Huben Weather & Climate: Best Time to Visit
Average temperatures, rainfall, sunshine and the best time to visit Huben.
Climate overview of Huben
Huben, Tyrol, Austria, sees big temperature differences between seasons, with July peaking at 17°C (63°F) and January dropping to -4°C (25°F).
Rain/snowfall is high, totalling around 1557 mm (61 in) per year. July is the wettest month and January the driest. The city also experiences a distinct rainy season from June to August. August is the sunniest month, averaging 6.2 hours of sunshine per day.
Huben Weather by Month
Pick a month to see the average temperature, rainfall and sunshine in Huben — and find the best time to visit.
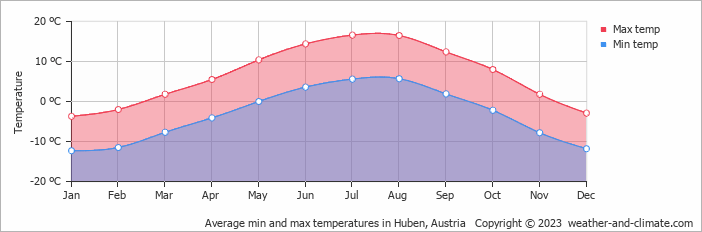
Monthly Temperature in Huben
Visitors to Huben can expect significant temperature changes throughout the year. Average maximum daytime temperatures range from a moderate 17°C (63°F) in July, the warmest time of the year, to a very cold -4°C (25°F) during cooler months like January.
At night, you can expect temperatures ranging from 6°C (43°F) in July to around -12°C (10°F) during January.
Check out our detailed temperature page for more information.
Temperature ranges by month
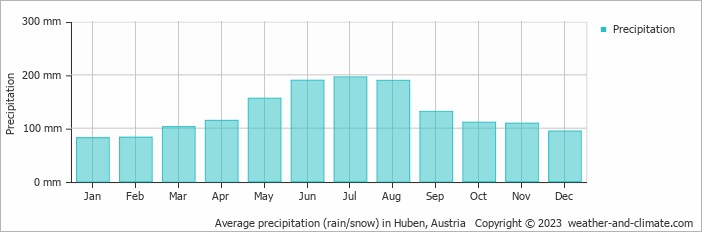
Rainfall in Huben
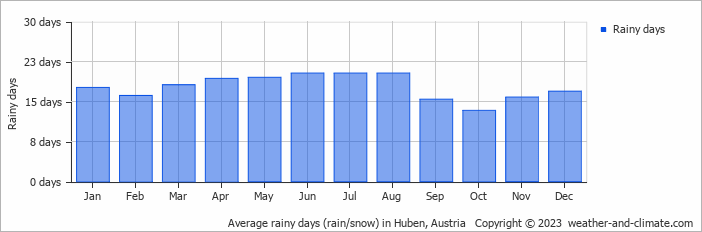
Huben is known for its substantial rain/snowfall, with annual precipitation reaching 1557 mm (61 in). Significant seasonal changes in precipitation occur throughout the year. In the wettest month, July it receives heavy rainfall, averaging 196 mm (7.7 in) of precipitation, recorded across 20 rainy days. In contrast, the driest month January brings less snowfall, with 82 mm (3.2 in) over 18 snowy days. For more details, please visit our Huben Precipitation page.
The mean monthly precipitation over the year, including rain, hail, and snow
The average number of days each month with precipitation
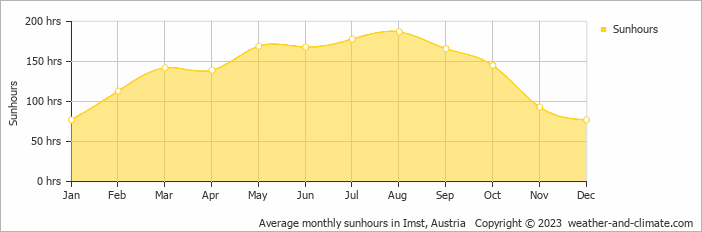
Sunshine Hours in Huben
Seasonal changes in sunshine hours are quite dramatic in Huben. While August receives considerable daily sunshine with up to 6.2 hours, January marks the darkest time of the year, where sunshine is scarce with only 2.6 hours of sunlight per day.
Visit our detailed sunshine hours page for more information.
Monthly hours of sunshine
Daily hours of sunshine
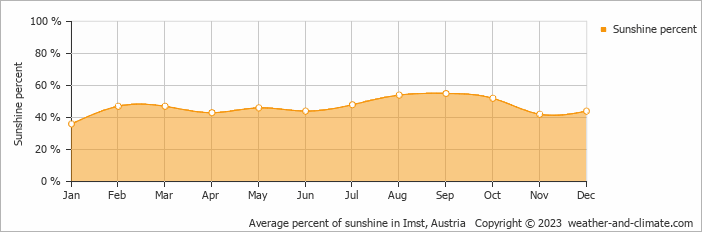
Daily percentage of sunshine
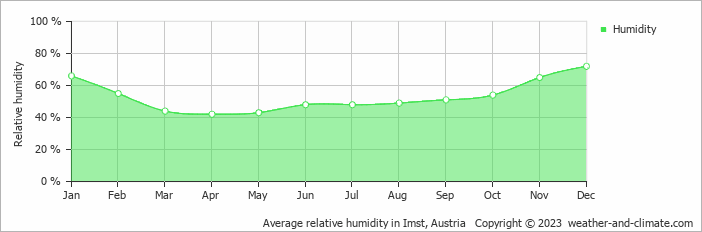
Humidity in Huben by Month
The relative humidity is moderate throughout the year in Huben.
The city experiences its highest humidity in December, reaching 72%. In April, the humidity drops to its lowest level at 42%. What does this mean? Read our detailed page on humidity levels for further details.
Relative humidity over the year
Best Time to Visit Huben
The weather does bring rainfall during this period, between 189 mm (7.4 in) and 196 mm (7.7 in).
Plan accordingly for June, July and August, when conditions bring the heaviest precipitation. Seeking the perfect travel destination for this year? We've created a tool that suggests locations matching your desired weather. Let our weather planner guide your travel decisions.
Frequently asked questions about the climate in Huben
What is the best time to visit Huben?
Huben has a distinct rainy season from June to August.
What temperatures can I expect in Huben?
Daytime highs range from -4°C (25°F) in January to 17°C (63°F) in July. Nighttime lows range from -12°C (10°F) to 6°C (43°F). Temperatures vary considerably through the year.
How much rain does Huben get?
Annual rainfall is around 1557 mm (61 in). July is the wettest month with 196 mm (7.7 in), while January is the driest with 82 mm (3.2 in).
How sunny is Huben?
Huben receives around 1,654 hours of sunshine per year. August is the sunniest month with 187 hours, while January is the cloudiest with just 77 hours.
Huben 3-Day Forecast
Huben 3-Day Forecast
Huben on the map
Huben is highlighted — select any city to see its climate.
Popular this month
Where to go in June — average daytime high across popular destinations.
Bucket list
Need travel inspiration? Check out our bucket list articles and be inspired.
 Ski Arlberg is the snow mecca of the Alps
Ski Arlberg is one of the most extensive and snow-sure ski resorts in Austria. In this area you will find challenging slopes, bustling après-ski and a combination of sporty and traditional villages.
Snowbombing Festival in Austria
Snowbombing Festival in Austria. Imagine that you can combine your favorite festival with all the benefits of a winter sports holiday.
Cycle the Danube trail
The Danube cycle route is one of the most popular cycling routes in Europe, and rightly so, because it is a varied route that is interesting both in terms of culture and nature.