Huaraz Weather & Climate: Best Time to Visit
Average temperatures, rainfall, sunshine and the best time to visit Huaraz.
Climate overview of Huaraz
Huaraz, in Ancash, Peru, maintains relatively stable temperatures year-round due to its elevation in the Andes. Days are typically mild to warm, while nights can be quite cool. The city receives a moderate amount of rainfall, with wetter conditions from late autumn to early spring. Huaraz is a well-known base for trekking and high-altitude adventure, and its mountain climate plays a key role in shaping travel plans. Now, let’s explore all the climate details to give you a complete picture.
Huaraz Weather by Month
Pick a month to see the average temperature, rainfall and sunshine in Huaraz — and find the best time to visit.
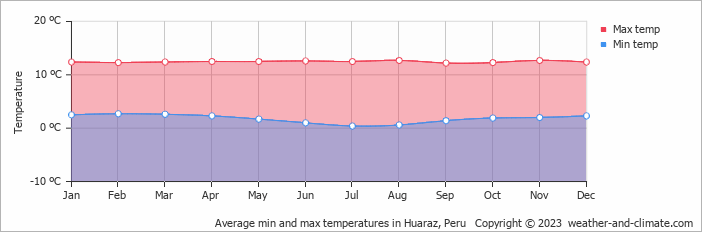
Monthly Temperature in Huaraz
The climate in Huaraz remains fairly constant, offering moderate temperatures throughout the year. On average, daytime temperatures range from a moderate 13°C (55°F) in August to a moderate 12°C (54°F) in July.
Nighttime temperatures range from 3°C (37°F) in August to 0°C (32°F) in July.
Check out our detailed temperature page for more information.
Temperature ranges by month
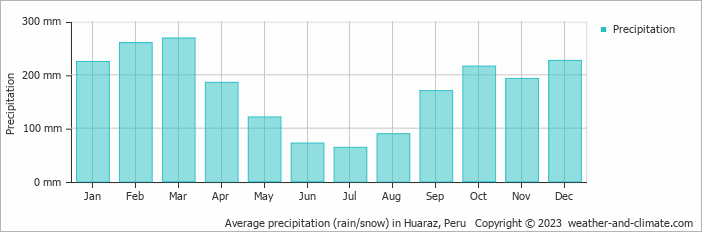
Rainfall in Huaraz
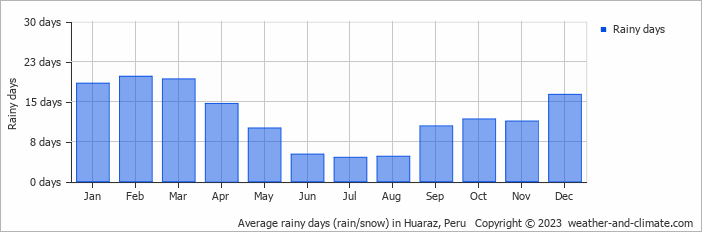
Generally, Huaraz experiences moderate precipitation patterns, averaging 846 mm (33 in) yearly. The seasons in Huaraz bring significant changes in precipitation. The wettest month, March, receives heavy rainfall, with an average of 165 mm (6.5 in) of precipitation. This rainfall is distributed across 19 rainy days.
In contrast, the driest month, July, experiences much less rainfall, totaling 3 mm (0.1 in) over 5 rainy days. These distinct seasonal differences provide diverse experiences throughout the year. For more details, please visit our Huaraz Precipitation page.
The mean monthly precipitation over the year, including rain, hail, and snow
The average number of days each month with precipitation
Best Time to Visit Huaraz
The weather does bring rainfall during this period, between 3 mm (0.1 in) and 32 mm (1.3 in).
Plan accordingly for March, when conditions bring the heaviest precipitation. Need help choosing your next travel destination? We offer a specialized tool that matches you with locations based on your weather preferences. Explore destinations that suit your climate preferences.
Frequently asked questions about the climate in Huaraz
What is the best time to visit Huaraz?
June, July, August and September typically offer the most optimal weather in Huaraz. In contrast, January, February, March and December tend to have less optimal conditions. Huaraz has a distinct dry season from May to September.
What temperatures can I expect in Huaraz?
Daytime highs range from 12°C (54°F) in July to 13°C (55°F) in August. Nighttime lows range from 0°C (32°F) to 3°C (37°F). Temperatures stay relatively stable year-round.
How much rain does Huaraz get?
Annual rainfall is around 846 mm (33 in). March is the wettest month with 165 mm (6.5 in), while July is the driest with 3 mm (0.1 in).
Huaraz 3-Day Forecast
Huaraz 3-Day Forecast
Huaraz on the map
Huaraz is highlighted — select any city to see its climate.
Popular this month
Where to go in July — average daytime high across popular destinations.
Bucket list
Need travel inspiration? Check out our bucket list articles and be inspired.
 Visit the Rainbow Mountains
The Rainbow Mountain (Vinicunca) is acolored rainbow mountain that will steal your heart forever and the view from the top will take your breath away.
"The other" Machu Picchu: the Inca City of Choquequirao
Discover Choquequirao, the hidden Inca city near Cusco. Hike through stunning landscapes and explore ancient ruins with fewer crowds than Machu Picchu.
Hike the inca Trail
Few walking tours speak so much to the imagination as the Inca Trail to Machu Picchu. The tour leads through beautiful mountain landscapes and it is called the 'Royal Highway'
The Inkaterra Reserva Amazonica
One of your highlights during a trip in Peru might be this eco-luxury lodge in front of the Madre de Dios River, called Inkaterra Reserva Amazonica.