Hjallerup Weather & Climate: Best Time to Visit
Average temperatures, rainfall, sunshine and the best time to visit Hjallerup.
Climate overview of Hjallerup
The climate in Hjallerup, Nordjylland, Denmark, is marked by large temperature swings across the seasons, ranging from 21°C (70°F) in July to 5°C (41°F) in February.
Annual rain/snowfall is moderate at around 813 mm (32 in), with August being the wettest month. Sunshine peaks in June, when the city sees around 9.1 hours of sunshine per day.
Hjallerup Weather by Month
Pick a month to see the average temperature, rainfall and sunshine in Hjallerup — and find the best time to visit.
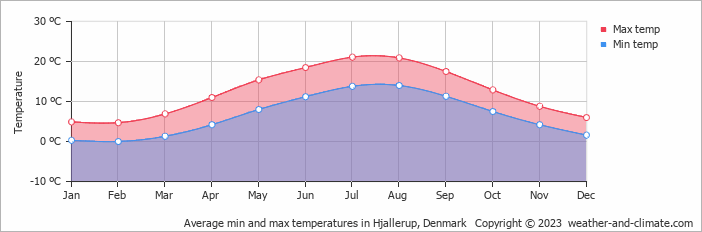
Monthly Temperature in Hjallerup
In Hjallerup, temperatures differ significantly between summer and winter months. Average daytime temperatures reach a pleasant 21°C (70°F) in July. In February, the coolest month of the year, temperatures drop to a chilly 5°C (41°F).
At night, temperatures range from around 14°C (57°F) in July to 0°C (32°F) in February.
Check out our detailed temperature page for more information.
Temperature ranges by month
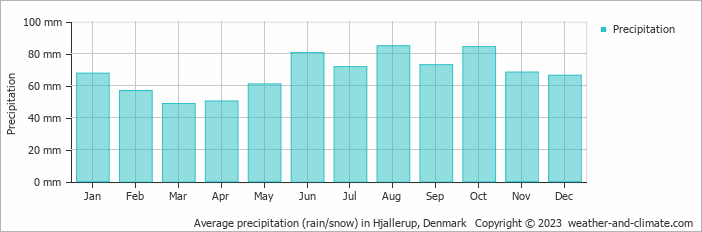
Rainfall in Hjallerup
On average, Hjallerup receives a reasonable amount of rain/snowfall, with an annual precipitation of 813 mm (32 in). Hjallerup experiences moderate seasonal variation in rainfall, with monthly averages ranging from 85 mm (3.3 in) in August, the wettest month, and 49 mm (1.9 in) in March, the driest month. For more details, please visit our Hjallerup Precipitation page.
The mean monthly precipitation over the year, including rain, hail, and snow
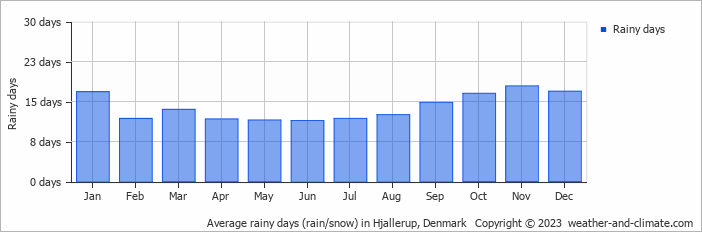
The average number of days each month with precipitation
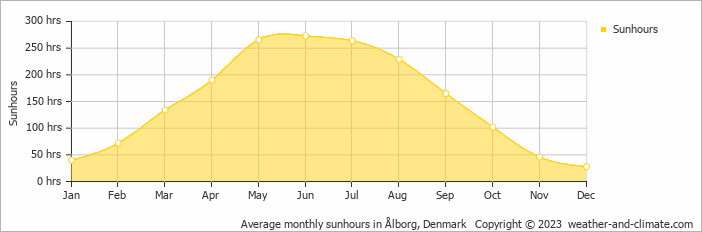
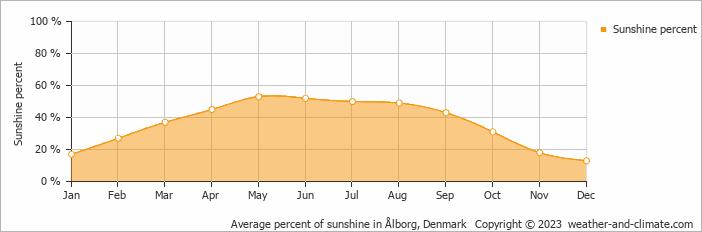
Sunshine Hours in Hjallerup
Hjallerup can be enjoyed more throughout the sunniest month of June under a blue sky, with approximately 9.1 hours of sunshine daily. In contrast, the city experiences much darker days in December, with only 0.9 hours of sunlight per day.
Visit our detailed sunshine hours page for more information.
Monthly hours of sunshine
Daily hours of sunshine
Daily percentage of sunshine
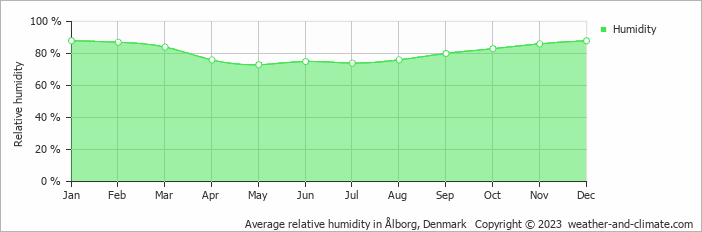
Humidity in Hjallerup by Month
The city experiences its highest humidity in January, reaching 88%. In May, the humidity drops to its lowest level at 73%. What does this mean? Read our detailed page on humidity levels for further details.
Relative humidity over the year
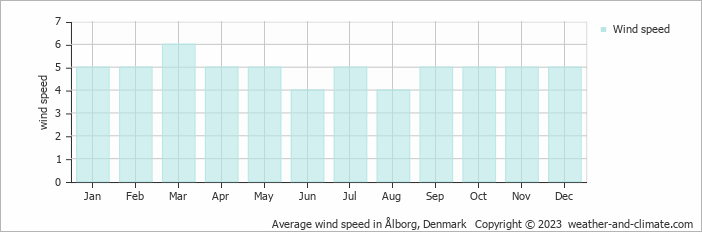
Wind Speed in Hjallerup
The mean wind speed varies between 4 m/s (8 knots) and 6 m/s (12 knots) throughout the year. It is lowest in June and August and highest during March. What does this mean?
The mean monthly wind speed over the year (meters per second)
Best Time to Visit Hjallerup
Frequently asked questions about the climate in Hjallerup
What is the best time to visit Hjallerup?
July and August typically offer the most optimal weather in Hjallerup. In contrast, January, February, March, November and December tend to have less optimal conditions.
What temperatures can I expect in Hjallerup?
Daytime highs range from 5°C (41°F) in February to 21°C (70°F) in July. Nighttime lows range from 0°C (32°F) to 14°C (57°F). Temperatures vary considerably through the year.
How much rain does Hjallerup get?
Annual rainfall is around 813 mm (32 in). August is the wettest month with 85 mm (3.3 in), while March is the driest with 49 mm (1.9 in).
How sunny is Hjallerup?
Hjallerup receives around 1,809 hours of sunshine per year. June is the sunniest month with 273 hours, while December is the cloudiest with just 28 hours.
Hjallerup 3-Day Forecast
Hjallerup 3-Day Forecast
Hjallerup on the map
Hjallerup is highlighted — select any city to see its climate.
Popular this month
Where to go in July — average daytime high across popular destinations.