Halkær Weather & Climate: Best Time to Visit
Average temperatures, rainfall, sunshine and the best time to visit Halkær.
Climate overview of Halkær
Halkær, Midtjylland, Denmark, sees big temperature differences between seasons, with August peaking at 20°C (68°F) and February dropping to 5°C (41°F).
With around 1053 mm (41 in) of annual rain/snowfall, Halkær has a notably wet climate. The wettest month is October. The sunniest month is June, with 8.3 hours of sunshine per day on average.
Halkær Weather by Month
Pick a month to see the average temperature, rainfall and sunshine in Halkær — and find the best time to visit.
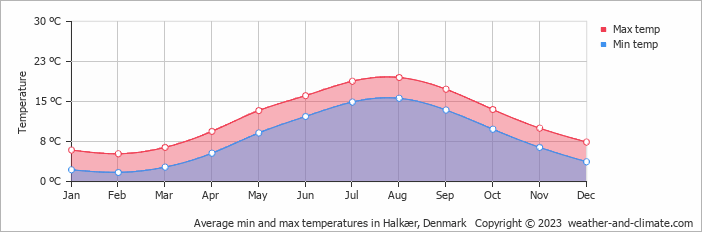
Monthly Temperature in Halkær
Visitors to Halkær can expect significant temperature changes throughout the year. Average daytime temperatures reach a pleasant 20°C (68°F) in August. In February, the coolest month of the year, temperatures drop to a chilly 5°C (41°F).
At night, temperatures range from around 16°C (61°F) in August to 2°C (36°F) in February.
Check out our detailed temperature page for more information.
Temperature ranges by month
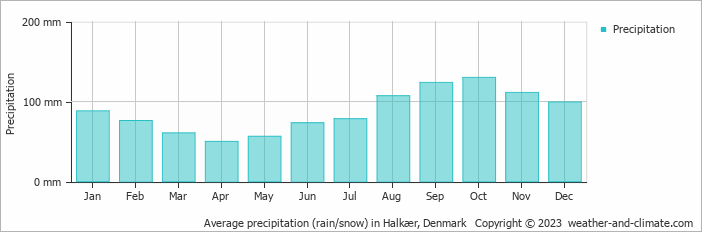
Rainfall in Halkær
Halkær is known for its substantial rain/snowfall, with annual precipitation reaching 1053 mm (41 in). Halkær can be quite wet during October, receiving approximately 130 mm (5.1 in) of precipitation over 17 rainy days.
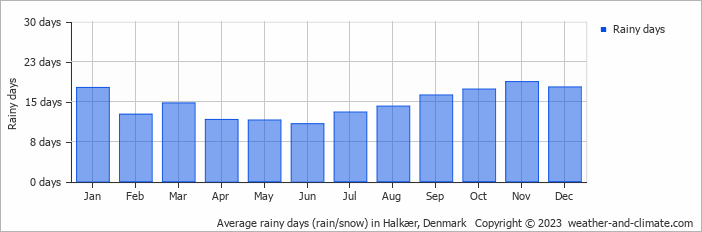
In contrast, during the driest month (April), you will experience much drier conditions, with 50 mm (2 in) of precipitation spread across 12 rainy days days. For more details, please visit our Halkær Precipitation page.
The mean monthly precipitation over the year, including rain, hail, and snow
The average number of days each month with precipitation
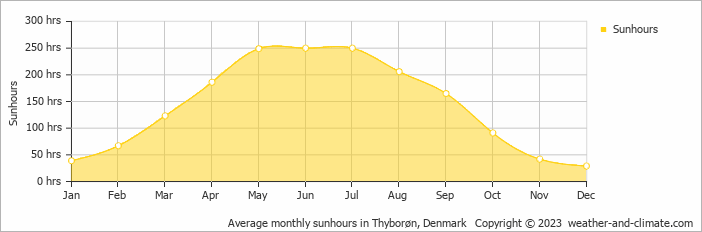
Sunshine Hours in Halkær
Halkær can be enjoyed more throughout the sunniest month of June under a blue sky, with approximately 8.3 hours of sunshine daily. In contrast, the city experiences much darker days in December, with only 1.0 hours of sunlight per day.
Visit our detailed sunshine hours page for more information.
Monthly hours of sunshine
Daily hours of sunshine
Daily percentage of sunshine
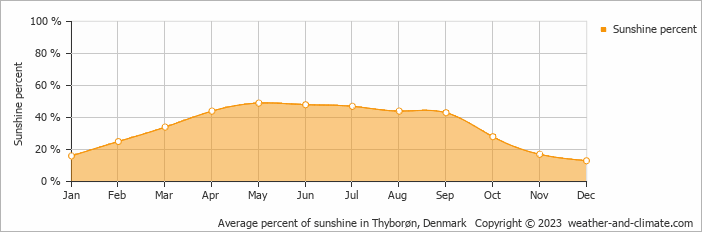
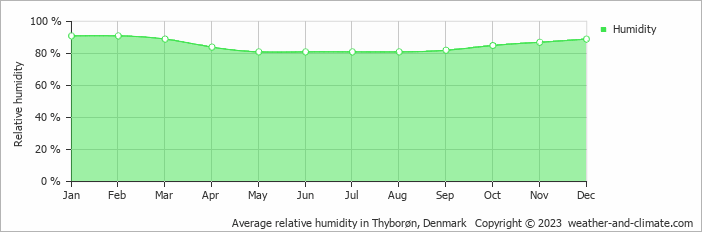
Humidity in Halkær by Month
The city experiences its highest humidity in January, reaching 91%. In May, the humidity drops to its lowest level at 81%. What does this mean? Read our detailed page on humidity levels for further details.
Relative humidity over the year
Best Time to Visit Halkær
The weather does bring rainfall during this period, between 73 mm (2.9 in) and 124 mm (4.9 in). Wondering where to travel based on your weather preferences? Our recommendation tool helps you find destinations with your ideal climate conditions. Use our weather planner to find your perfect destination.
Frequently asked questions about the climate in Halkær
What is the best time to visit Halkær?
July and August typically offer the most optimal weather in Halkær. In contrast, January, February, March, April, November and December tend to have less optimal conditions.
What temperatures can I expect in Halkær?
Daytime highs range from 5°C (41°F) in February to 20°C (68°F) in August. Nighttime lows range from 2°C (36°F) to 16°C (61°F). Temperatures vary considerably through the year.
How much rain does Halkær get?
Annual rainfall is around 1053 mm (41 in). October is the wettest month with 130 mm (5.1 in), while April is the driest with 50 mm (2 in).
How sunny is Halkær?
Halkær receives around 1,697 hours of sunshine per year. June is the sunniest month with 250 hours, while December is the cloudiest with just 29 hours.
Halkær 3-Day Forecast
Halkær 3-Day Forecast
Halkær on the map
Halkær is highlighted — select any city to see its climate.
Popular this month
Where to go in July — average daytime high across popular destinations.