Gran Tarajal Weather & Climate: Best Time to Visit
Gran Tarajal, Canary Islands, Spain, experiences moderate temperature changes through the seasons. August is the warmest month with daytime highs of 28°C (82°F), while January is the coolest at 21°C (70°F).
The area sees almost no rainfall, totalling just 84 mm (3.3 in) per year. The sunniest month is July, with 9.9 hours of sunshine per day on average.
Monthly Temperature in Gran Tarajal
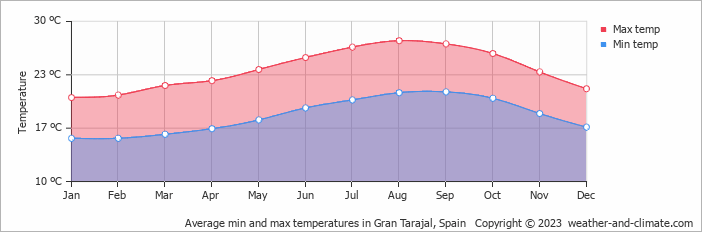
The climate in Gran Tarajal experiences moderate temperature changes, with mild shifts between seasons. Typically, average maximum daytime temperatures range from a comfortable 28°C (82°F) in August to a pleasant 21°C (70°F) in the coolest month, January.
Nights vary from 21°C (70°F) in August to around 15°C (59°F) during the colder months.
Check out our detailed temperature page for more information.
Temperature ranges by month
Rainfall in Gran Tarajal
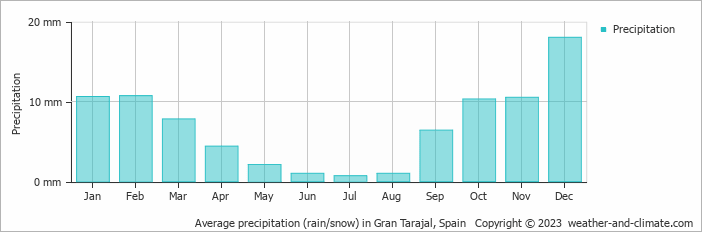
Gran Tarajal has a dry climate with very low precipitation, averaging 84 mm (3.3 in) of rainfall annually. The climate in Gran Tarajal shows significant variation throughout the year. Expect low rainfall in December, the wettest month, with an average of 18 mm (0.7 in) of precipitation over 3 rainy days.
In contrast, the driest month July offers drier and sunnier days, with around 0.7 mm (0.03 in) of rainfall over 0 rainy days. For more details, please visit our Gran Tarajal Precipitation page.
The mean monthly precipitation over the year, including rain, hail, and snow
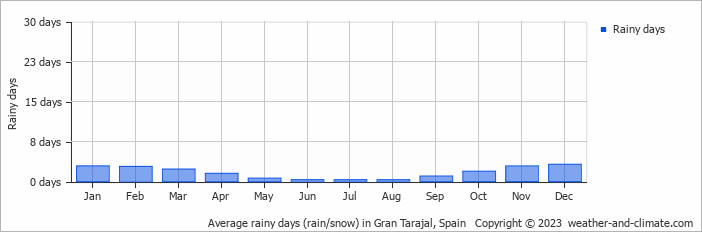
The average number of days each month with precipitation
Sunshine Hours in Gran Tarajal
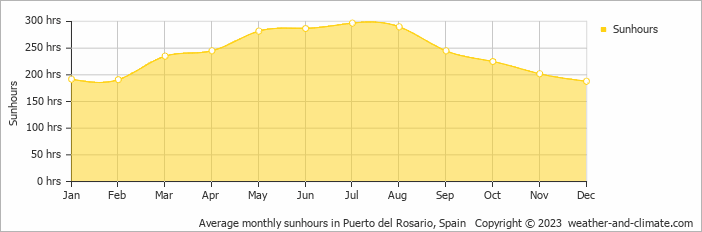
Gran Tarajal offers a pleasant mix of sunny and slightly overcast days. The difference in sunshine hours between July (9.9 hours daily) and December (6.3 hours daily) provides a bit of variety for visitors and residents.
Visit our detailed sunshine hours page for more information.
Monthly hours of sunshine
Daily hours of sunshine
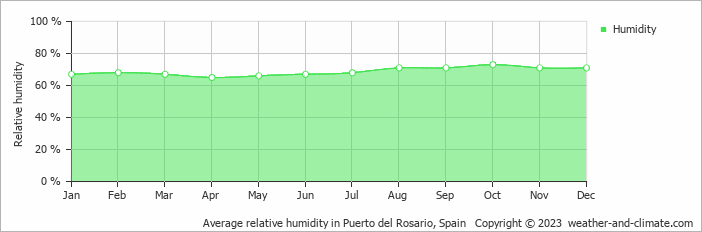
Humidity in Gran Tarajal by Month
The relative humidity is high throughout the year in Gran Tarajal.
The city experiences its highest humidity in October, reaching 73%. In April, the humidity drops to its lowest level at 65%. What does this mean? Read our detailed page on humidity levels for further details.
Relative humidity over the year
Gran Tarajal 3-Day Forecast
Check the conditions for any month of the year.


