Curití Weather & Climate: Best Time to Visit
The climate in Curití, Santander, Colombia, is remarkably consistent, with temperatures year-round averaging 25°C (77°F). The warmest month is February at 26°C (79°F), and the coolest is January at 25°C (77°F).
With around 5317 mm (209 in) of annual rainfall, Curití has a notably wet climate. The wettest month is June. The most sunshine falls in January, with an average of 7.0 hours of daily sunshine.
Monthly Temperature in Curití
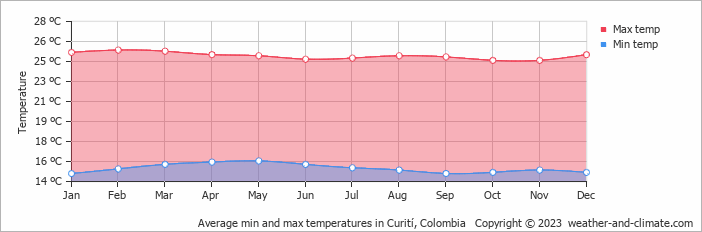
In Curití temperatures are generally consistent throughout the year. Average daytime temperatures reach a comfortable 26°C (79°F) in February. In January, the coolest month of the year, temperatures drop to a comfortable 25°C (77°F).
At night, temperatures range from around 16°C (61°F) in February to 15°C (59°F) in January.
Check out our detailed temperature page for more information.
Temperature ranges by month
Rainfall in Curití
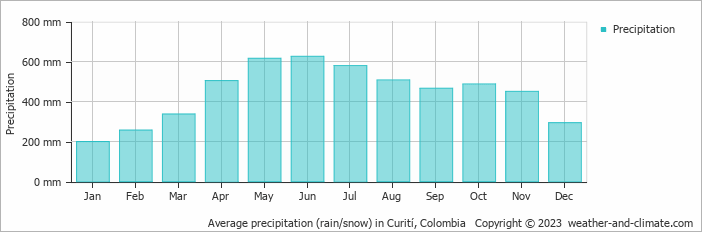
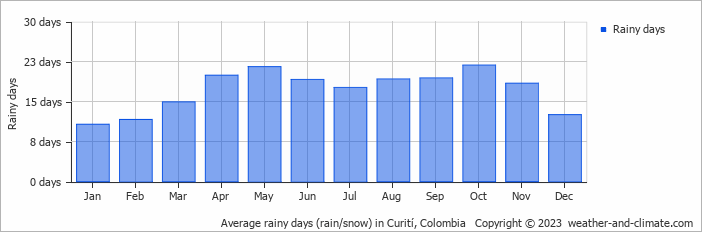
Curití experiences significant rainfall throughout the year, averaging 5317 mm (209 in) of precipitation annually. Curití can be quite wet during June, receiving approximately 625 mm (25 in) of precipitation over 19 rainy days.
In contrast, during the driest month (January), you will experience much drier conditions, with 199 mm (7.8 in) of precipitation spread across 11 rainy days days. For more details, please visit our Curití Precipitation page.
The mean monthly precipitation over the year, including rain, hail, and snow
The average number of days each month with precipitation
Sunshine Hours in Curití
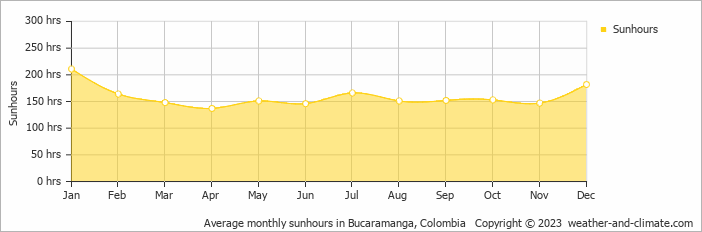
Curití experiences moderate variation in sunshine hours across the seasons. With 7.0 hours daily sunshine in January, it dips to 4.6 hours in April, offering a balanced mix of sunny and overcast days.
Visit our detailed sunshine hours page for more information.
Monthly hours of sunshine
Daily hours of sunshine
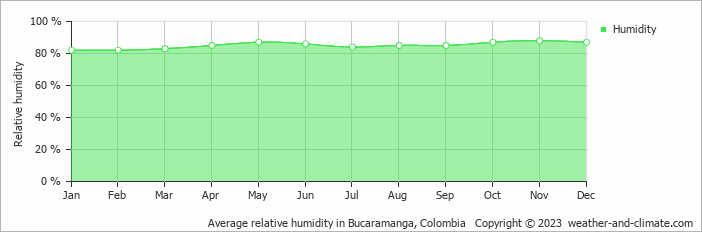
Humidity in Curití by Month
The city experiences its highest humidity in November, reaching 88%. In January, the humidity drops to its lowest level at 82%. What does this mean? Read our detailed page on humidity levels for further details.
Relative humidity over the year
Curití 3-Day Forecast
Check the conditions for any month of the year.
Best Time to Visit Curití
Throughout the year, Curití receives heavy precipitation with no month falling below 160 mm (6.3 in) of rainfall. This creates a perpetually wet climate with consistent rain patterns. The relatively driest month is January with 199 mm (7.8 in), though this still represents significant rainfall.Visitors should come prepared for wet weather regardless of when they visit, bring a poncho or umbrella. Ready to plan your travels but need destination ideas? Our smart tool recommends places based on the climate conditions you prefer. Start planning with our destination weather tool.


