Chur Weather & Climate: Best Time to Visit
Average temperatures, rainfall, sunshine and the best time to visit Chur.
Climate overview of Chur
Chur, Grisons, Switzerland, sees big temperature differences between seasons, with July peaking at 19°C (66°F) and January dropping to -1°C (30°F).
With around 1692 mm (67 in) of annual rain/snowfall, Chur has a notably wet climate. However, this rain/snowfall is not evenly distributed, the city has a distinct rainy season from June to August, with pleasant summers and very cold winters. The wettest month is June. July is the sunniest month, averaging 6.3 hours of sunshine per day.
Chur Weather by Month
Pick a month to see the average temperature, rainfall and sunshine in Chur - and find the best time to visit.
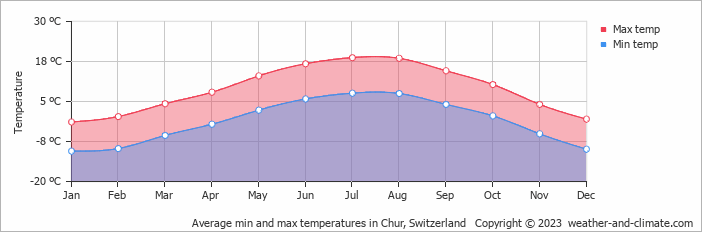
Monthly Temperature in Chur
Visitors to Chur can expect significant temperature changes throughout the year. Average daytime temperatures reach a pleasant 19°C (66°F) in July. In January, the coolest month of the year, temperatures drop to a very cold -1°C (30°F).
At night, temperatures range from around 8°C (46°F) in July to -11°C (12°F) in January.
Check out our detailed temperature page for more information.
Temperature ranges by month
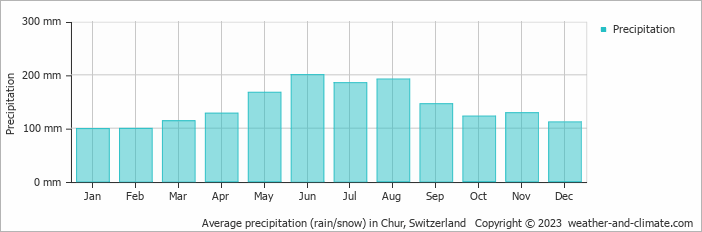
Rainfall in Chur
Chur is known for its substantial rain/snowfall, with annual precipitation reaching 1692 mm (67 in). Chur experiences moderate seasonal variation in rainfall, with monthly averages ranging from 200 mm (7.9 in) in June, the wettest month, and 99 mm (3.9 in) in January, the driest month. For more details, please visit our Chur Precipitation page.
The mean monthly precipitation over the year, including rain, hail, and snow
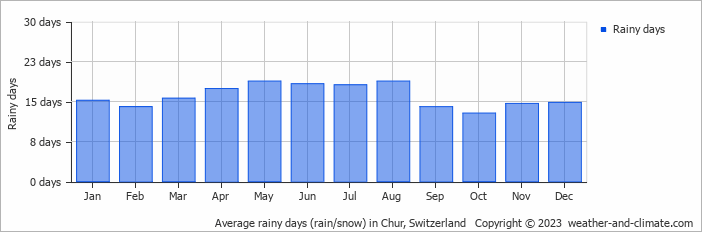
The average number of days each month with precipitation
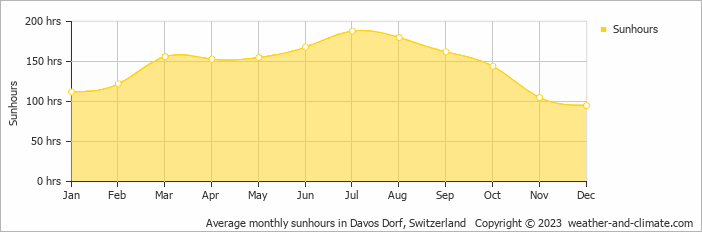
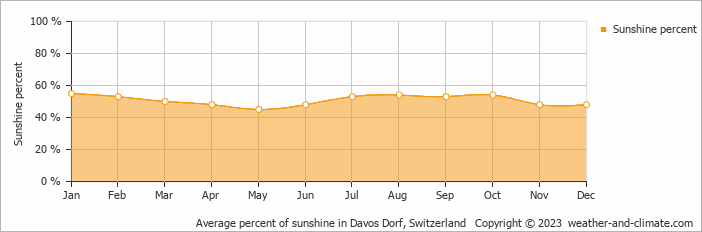
Sunshine Hours in Chur
Chur can be enjoyed more throughout the sunniest month of July under a blue sky, with approximately 6.3 hours of sunshine daily. In contrast, the city experiences much darker days in December, with only 3.2 hours of sunlight per day.
Visit our detailed sunshine hours page for more information.
Monthly hours of sunshine
Daily hours of sunshine
Daily percentage of sunshine
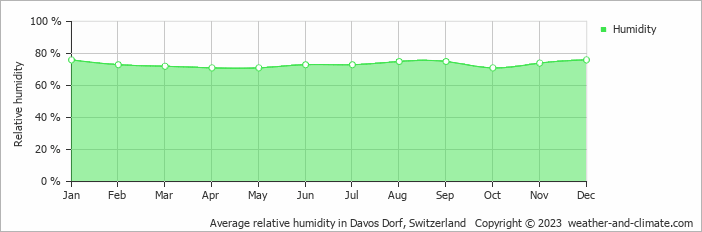
Humidity in Chur by Month
The relative humidity is high throughout the year in Chur.
The city experiences its highest humidity in January, reaching 76%. In April, the humidity drops to its lowest level at 71%. What does this mean? Read our detailed page on humidity levels for further details.
Relative humidity over the year
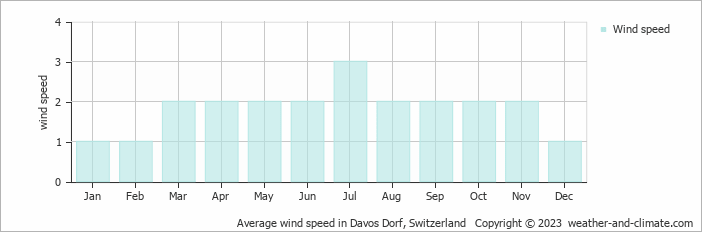
Wind Speed in Chur
The average wind speed over the year ranges from 1 m/s (2 knots) to 3 m/s (6 knots). It is lower in January, February and December and higher in July. What does this mean?
The mean monthly wind speed over the year (meters per second)
Best Time to Visit Chur
Monthly ratings reflect general weather comfort, based on daytime temperature and rainfall. Swimming and winter conditions are highlighted separately where relevant.
- Best overall: July, August and September
- Warmest weather: July and August
- Most sunshine: July and August
- Seasonal pattern: A distinct rainy season from June to August, with pleasant summers and very cold winters
- Coldest conditions: January, with freezing nights around -11°C (12°F).
Frequently asked questions about the climate in Chur
What is the best time to visit Chur?
July, August and September typically offer the most optimal weather in Chur. In contrast, January, February, March, April, May, June, October, November and December tend to have less optimal conditions. Chur has a distinct rainy season from June to August, with pleasant summers and very cold winters.
What temperatures can I expect in Chur?
Daytime highs range from -1°C (30°F) in January to 19°C (66°F) in July. Nighttime lows range from -11°C (12°F) to 8°C (46°F). Temperatures vary considerably through the year.
How much rain does Chur get?
Annual rainfall is around 1692 mm (67 in). June is the wettest month with 200 mm (7.9 in), while January is the driest with 99 mm (3.9 in).
How sunny is Chur?
Chur receives around 1,740 hours of sunshine per year. July is the sunniest month with 188 hours, while December is the cloudiest with just 95 hours.
Chur 3-Day Forecast
Chur on the map
Chur is highlighted - select any city to see its climate.
Popular this month
Where to go in July - average daytime high across popular destinations.
Bucket list
Need travel inspiration? Check out our bucket list articles and be inspired.
 The 5 most scenic train journeys in Switzerland
Explore Switzerland's top 5 train journeys, featuring breathtaking Alpine views and engineering marvels like the Glacier Express and Bernina Express.
You'll love this Mountain roller coaster
Hotel Oeschinensee’s mountain coaster is a summer toboggan that you want to add to your bucket list. You'll get in your cart, sit down and fly across the track while enjoying the beautiful mountain scenery around you.
The Verzasca Valley
You can visit the Verzasca Valley in any season. It's an amazing place for swimming and it is a paradise for hikers. A must see for the bucket list.
Balloon at Chateau D'oex
If you are looking for a special place to visit in Europe in January we recommend visiting the annual balloon festival in Château-d'Oex, Switzerland.