Cazorla Weather & Climate: Best Time to Visit
Average temperatures, rainfall, sunshine and the best time to visit Cazorla.
Climate overview of Cazorla
Cazorla, Andalucía, Spain, experiences significant temperature variation throughout the year. Summers bring daytime highs of 34°C (93°F) in July, while winters cool to 12°C (54°F) in January.
With around 616 mm (24 in) of annual rain/snowfall, the city has moderate precipitation levels. December is the wettest month and July the driest. It also has a distinct dry season from June to September.
Cazorla Weather by Month
Pick a month to see the average temperature, rainfall and sunshine in Cazorla — and find the best time to visit.
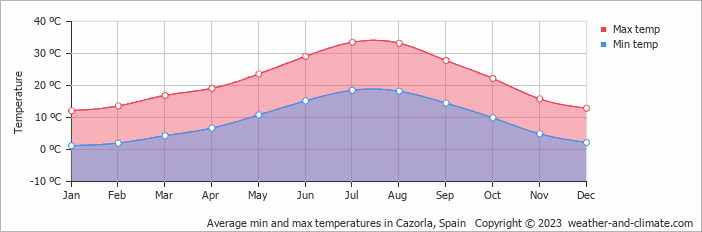
Monthly Temperature in Cazorla
Depending on the time of the year, temperatures range from very warm to moderate in Cazorla. Typically, average maximum daytime temperatures range from a very warm 34°C (93°F) in July to a moderate 12°C (54°F) in the coolest month, January.
Nights vary from 19°C (66°F) in July to around 1°C (34°F) during the colder months.
Check out our detailed temperature page for more information.
Temperature ranges by month
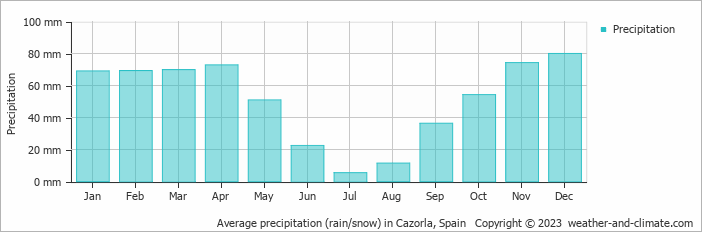
Rainfall in Cazorla
Generally, Cazorla has a moderate amount of precipitation, averaging 616 mm (24 in) of rain/snowfall annually. The climate in Cazorla shows significant variation throughout the year. Expect moderate rainfall in December, the wettest month, with an average of 80 mm (3.1 in) of precipitation over 14 rainy days.
In contrast, the driest month July offers drier and sunnier days, with around 5.4 mm (0.2 in) of rainfall over 4 rainy days. For more details, please visit our Cazorla Precipitation page.
The mean monthly precipitation over the year, including rain, hail, and snow
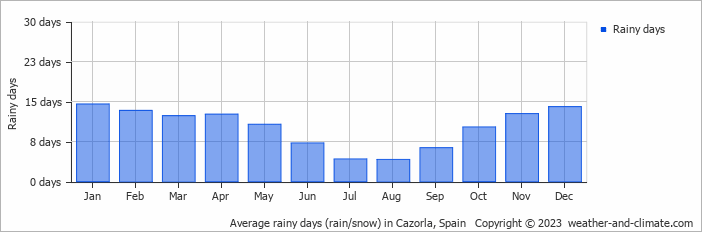
The average number of days each month with precipitation
Best Time to Visit Cazorla
Rainfall during this time ranges from 22 mm (0.9 in) in June to 73 mm (2.9 in) in April. This means you can expect a mix of sunny days and occasional showers. Planning your next adventure but unsure where to go? Our climate tool suggests perfect locations tailored to your preferred weather conditions. Discover your ideal travel destination with our weather planner.
Frequently asked questions about the climate in Cazorla
What is the best time to visit Cazorla?
May, June, September and October typically offer the most optimal weather in Cazorla. In contrast, July tends to have less optimal conditions. Cazorla has a distinct dry season from June to September.
What temperatures can I expect in Cazorla?
Daytime highs range from 12°C (54°F) in January to 34°C (93°F) in July. Nighttime lows range from 1°C (34°F) to 19°C (66°F). Temperatures vary considerably through the year.
How much rain does Cazorla get?
Annual rainfall is around 616 mm (24 in). December is the wettest month with 80 mm (3.1 in), while July is the driest with 5.4 mm (0.2 in).
Cazorla 3-Day Forecast
Cazorla 3-Day Forecast
Cazorla on the map
Cazorla is highlighted — select any city to see its climate.
Popular this month
Where to go in June — average daytime high across popular destinations.
Bucket list
Need travel inspiration? Check out our bucket list articles and be inspired.
 Enjoy an active trip in the mountains of Sierras de Cazorla
The mountains of Sierras de Cazorla offer spectacular views and sights and an abundance of activities that you can engage in, most of which are eco-friendly!
Visit national Park El Teide
This national park is truly a unique place that you should not miss. You will find landscapes that seem to come from another plane and you will feel tiny in these impressive surroundings.
Sevilla: A Blend of Tradition, Culture, and Hidden Gems
Experience Sevilla in spring with Semana Santa processions and Feria de Abril festivities, set against the city's iconic landmarks and vibrant culture.
Enjoy an active trip in the mountains of Sierras de Cazorla
The mountains of Sierras de Cazorla offer spectacular views and sights and an abundance of activities that you can engage in, most of which are eco-friendly!