Casas de Torrat Weather & Climate: Best Time to Visit
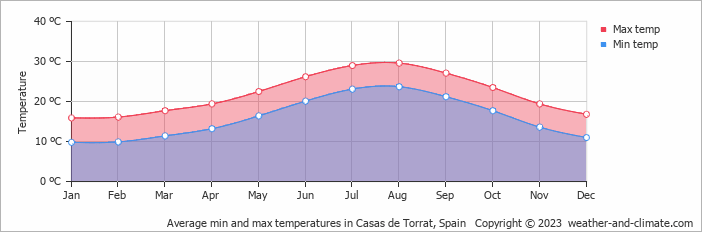
The climate in Casas de Torrat, Valencia Community, Spain, is marked by large temperature swings across the seasons, ranging from 30°C (86°F) in August to 16°C (61°F) in January.
Casas de Torrat sees a moderate amount of rainfall, totalling around 500 mm (20 in) per year. It experiences a distinct dry season from May to August, creating some seasonal variation.
Monthly Temperature in Casas de Torrat
In Casas de Torrat, temperatures differ significantly between summer and winter months. Average maximum daytime temperatures range from a comfortable 30°C (86°F) in August, the warmest time of the year, to a moderate 16°C (61°F) during cooler months like January.
At night, you can expect temperatures ranging from 24°C (75°F) in August to around 10°C (50°F) during January.
Check out our detailed temperature page for more information.
Temperature ranges by month
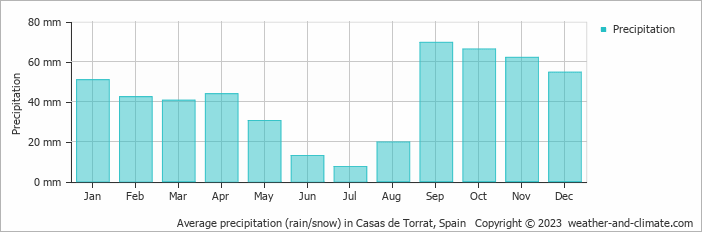
Rainfall in Casas de Torrat
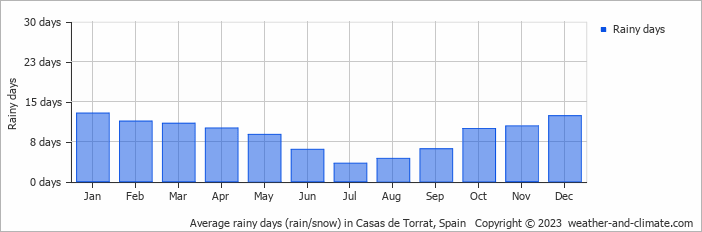
On average, Casas de Torrat receives a reasonable amount of rainfall, with an annual precipitation of 500 mm (20 in). Significant seasonal changes in precipitation occur throughout the year. In the wettest month, September it receives moderate rainfall, averaging 70 mm (2.8 in) of precipitation, recorded across 6 rainy days. In contrast, the driest month July brings less rainfall, with 7.4 mm (0.3 in) over 3 rainy days. For more details, please visit our Casas de Torrat Precipitation page.
The mean monthly precipitation over the year, including rain, hail, and snow
The average number of days each month with precipitation
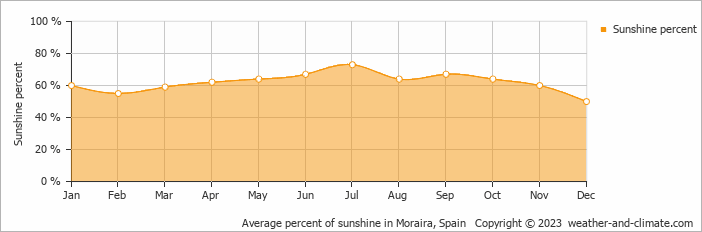
Daily percentage of sunshine
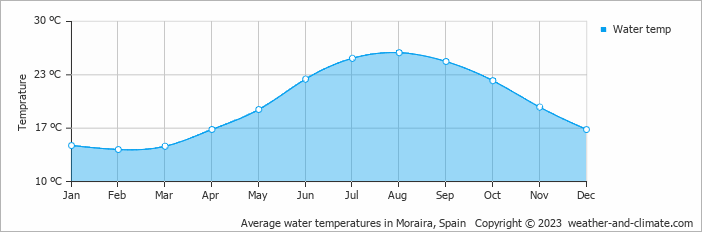
Water Temperature in Casas de Torrat
The mean water temperature over the year ranges from 14°C (57°F) in February to 26°C (79°F) in August.
Water temperature over the year
Casas de Torrat 3-Day Forecast
Check the conditions for any month of the year.


