Barcenilla Weather & Climate: Best Time to Visit
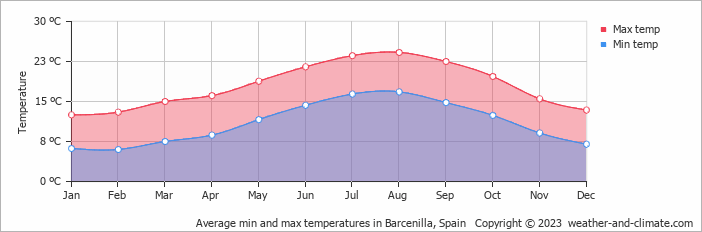
Temperatures in Barcenilla, Cantabria, Spain, vary greatly throughout the year. August is the hottest month at 24°C (75°F), while February is the coldest at 13°C (55°F).
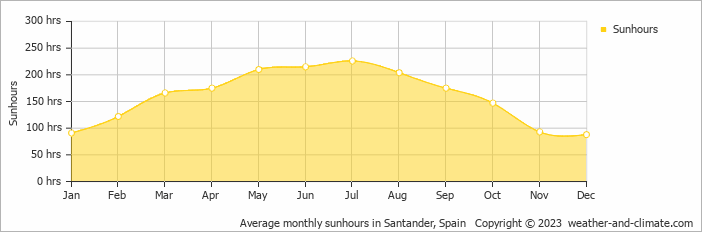
Rainfall is high, totalling around 1198 mm (47 in) per year. November is the wettest month and July the driest. The most sunshine falls in July, with an average of 7.5 hours of daily sunshine.
Monthly Temperature in Barcenilla
The climate in Barcenilla is known for significant temperature differences throughout the year, making the weather dynamic. Average maximum daytime temperatures range from a comfortable 24°C (75°F) in August, the warmest time of the year, to a moderate 13°C (55°F) during cooler months like February.
At night, you can expect temperatures ranging from 17°C (63°F) in August to around 6°C (43°F) during February.
Check out our detailed temperature page for more information.
Temperature ranges by month
Rainfall in Barcenilla
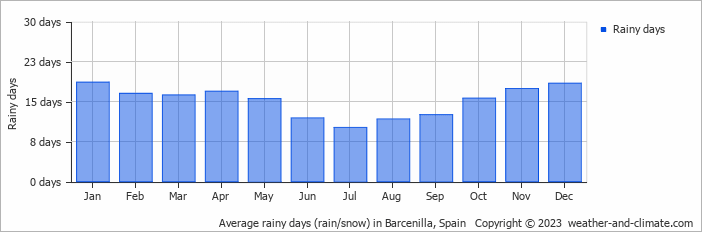
Barcenilla has a notably wet climate with abundant precipitation, recording 1198 mm (47 in) of rainfall per year. While rainfall varies throughout the year, each season offers its own charm. November brings wetter days averaging 141 mm (5.6 in) of precipitation, spread over 17 rainy days.
In contrast, the driest month July experiences a drier climate, with about 66 mm (2.6 in) of rainfall spread across 10 rainy days. For more details, please visit our Barcenilla Precipitation page.
The mean monthly precipitation over the year, including rain, hail, and snow

The average number of days each month with precipitation
Sunshine Hours in Barcenilla
Seasonal changes in sunshine hours are quite dramatic in Barcenilla. While July receives considerable daily sunshine with up to 7.5 hours, December marks the darkest time of the year, where sunshine is scarce with only 2.9 hours of sunlight per day.
Visit our detailed sunshine hours page for more information.
Monthly hours of sunshine
Daily hours of sunshine
Water Temperature in Barcenilla
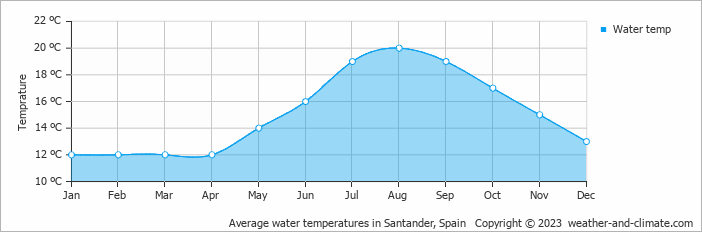
The mean water temperature over the year ranges from 12°C (54°F) in January to 20°C (68°F) in August.
Water temperature over the year
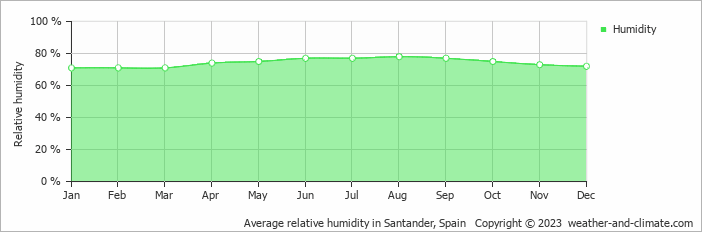
Humidity in Barcenilla by Month
The relative humidity is high throughout the year in Barcenilla.
The city experiences its highest humidity in August, reaching 78%. In January, the humidity drops to its lowest level at 71%. What does this mean? Read our detailed page on humidity levels for further details.
Relative humidity over the year
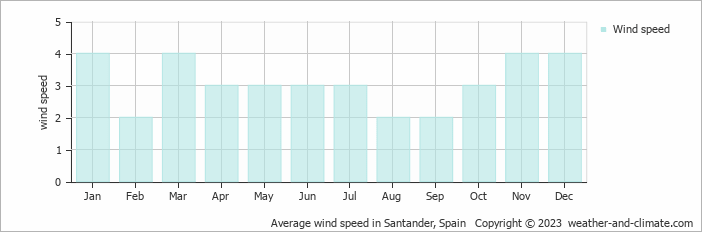
Wind Speed in Barcenilla
The mean wind speed varies between 2 m/s (4 knots) and 4 m/s (8 knots) throughout the year. It is lowest in February, August and September and highest during January, March, November and December. What does this mean?
The mean monthly wind speed over the year (meters per second)
Barcenilla 3-Day Forecast
Check the conditions for any month of the year.


