Barbat na Rabu Weather and Climate: A Comprehensive Guide
The climate in Barbat na Rabu is marked by big temperature swings throughout the year.
Temperatures range from warm during the warmest months
to cold in the cooler months.
It also has a relatively rainy climate with high levels of precipitation.
Now, let’s break down all the climate details for a clearer picture.
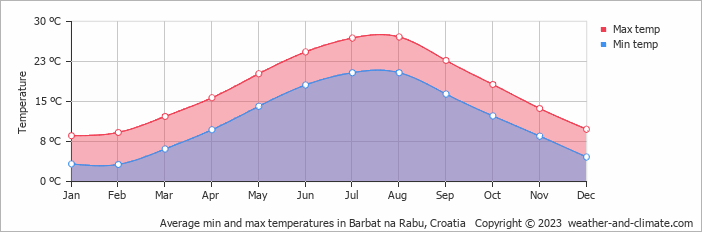
Average maximum day and minimum night temperature
In Barbat na Rabu, temperatures differ significantly between summer and winter months. On average, daytime temperatures range from a comfortable 27°C in August to a chilly 9°C in February.
Nighttime temperatures can drop, with average lows reaching 3°C in February. Check out our detailed temperature page for more information.Temperature ranges by month
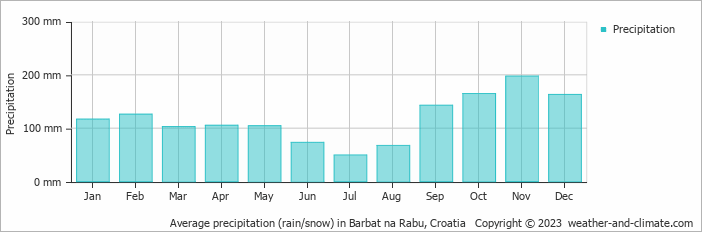
Precipitation and rainy days
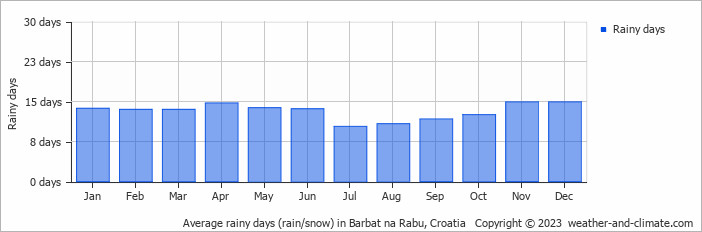
Barbat na Rabu experiences significant rainfall throughout the year, averaging 1412 mm of precipitation annually. The seasons in Barbat na Rabu, bring significant changes in precipitation. The wettest month, November, receives heavy rainfall, with an average of 197 mm of precipitation. This rainfall is distributed across 15 rainy days. In contrast, the driest month, July, experiences much less rainfall, totaling 50 mm over 10 rainy days. These distinct seasonal differences provide diverse experiences throughout the year. For more details, please visit our Barbat na Rabu Precipitation page.The mean monthly precipitation over the year, including rain, hail and snow
The average number of days each month with precipitation
Sunshine over the year
In Barbat na Rabu, summer days are longer and more sunny, with daily sunshine hours peaking at 10.3 hours in July. As the darker season arrives, the brightness of the sun becomes less. December sees a soft sun for only 3.0 hours per average day. Visit our detailed sunshine hours page for more information.Monthly hours of sunshine
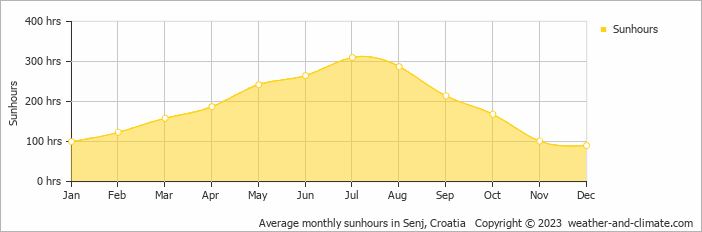
Daily hours of sunshine
broken clouds and slight rain overcast and rain broken clouds and slight rainForecast for Barbat na Rabu
 8 m/s
8 m/s![]() 8 m/s
8 m/s![]() 8 m/s
8 m/s![]()
The best time of year to visit Barbat na Rabu in Croatia
During the months of May, June and September you are most likely to experience good weather with pleasant average temperatures that fall between 20°C and 26°C.Other facts from our historical weather data:
Most rainfall (rainy season) is seen in October, November and December.
August has an average maximum temperature of 27°C and is the warmest month of the year.
The coldest month is February with an average maximum temperature of 9°C.
November tops the wettest month list with 197 mm of rainfall.
July is the driest month with 50 mm of precipitation.
July is the sunniest month with an average of 310 hours of sunshine.
No idea where to travel to this year? We have a tool that recommends destinations based on your ideal conditions. Find out where to go with our weather planner.


