Aratuba Beach Weather & Climate: Best Time to Visit
Aratuba Beach, Bahia, Brazil, has a stable climate with little temperature variation across the year. Average daytime temperatures hover around 28°C (82°F), peaking in February at 30°C (86°F) and dipping in August to 26°C (79°F).
The city receives considerable rainfall, with around 1516 mm (60 in) annually. May is the wettest month. It has a distinct rainy season from April to June. January is the sunniest month, averaging 8.2 hours of sunshine per day.
Monthly Temperature in Aratuba Beach
With minimal seasonal shifts, Aratuba Beach experiences a constant climate year-round. Typically, average maximum daytime temperatures range from a comfortable 30°C (86°F) in February to a comfortable 26°C (79°F) in the coolest month, August.
Nights vary from 25°C (77°F) in February to around 22°C (72°F) during the colder months.
Check out our detailed temperature page for more information.
Temperature ranges by month

Rainfall in Aratuba Beach
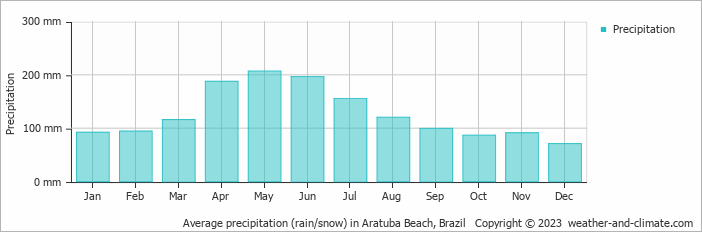
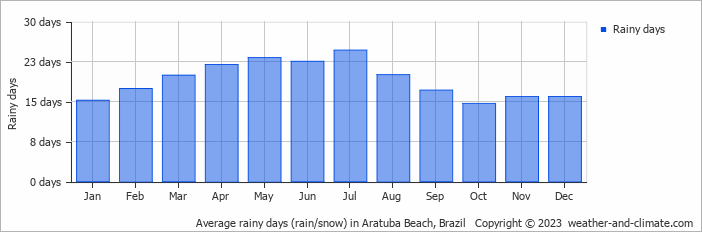
Aratuba Beach has a notably wet climate with abundant precipitation, recording 1516 mm (60 in) of rainfall per year. The climate in Aratuba Beach shows significant variation throughout the year. Expect heavy rainfall in May, the wettest month, with an average of 207 mm (8.1 in) of precipitation over 23 rainy days.
In contrast, the driest month December offers drier and sunnier days, with around 71 mm (2.8 in) of rainfall over 16 rainy days. For more details, please visit our Aratuba Beach Precipitation page.
The mean monthly precipitation over the year, including rain, hail, and snow
The average number of days each month with precipitation
Sunshine Hours in Aratuba Beach
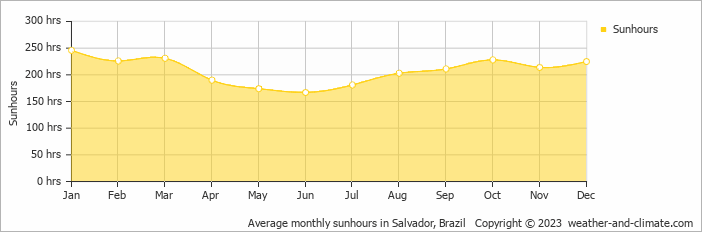
Aratuba Beach offers a pleasant mix of sunny and slightly overcast days. The difference in sunshine hours between January (8.2 hours daily) and June (5.6 hours daily) provides a bit of variety for visitors and residents.
Visit our detailed sunshine hours page for more information.
Monthly hours of sunshine
Daily hours of sunshine
Humidity in Aratuba Beach by Month
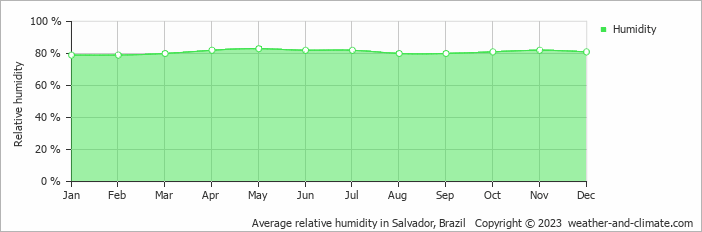
The city experiences its highest humidity in May, reaching 83%. In January, the humidity drops to its lowest level at 79%. What does this mean? Read our detailed page on humidity levels for further details.
Relative humidity over the year
Aratuba Beach 3-Day Forecast
Check the conditions for any month of the year.
Best Time to Visit Aratuba Beach
With its warm weather, Aratuba Beach experiences temperatures from 26°C (79°F) to 30°C (86°F) throughout the year. December offers the driest weather, which makes it a good time to visit.It's smart to plan your activities during the cooler morning hours or take advantage of the refreshing evenings.
Note that April, May and June make up the rainy season, with heavier precipitation expected. Planning your next adventure but unsure where to go? Our climate tool suggests perfect locations tailored to your preferred weather conditions. Discover your ideal travel destination with our weather planner.