Tarija Weather & Climate: Best Time to Visit
Average temperatures, rainfall, sunshine and the best time to visit Tarija.
Climate overview of Tarija
Tarija, in southern Bolivia, enjoys a mild and pleasant climate for most of the year. Rainfall is high, especially during the summer months. The city is known for its vineyards and relaxed pace, making it a good base for wine tasting and exploring the nearby valleys. Let’s explore the climate details to provide you with a complete overview.
Tarija Weather by Month
Pick a month to see the average temperature, rainfall and sunshine in Tarija — and find the best time to visit.
Monthly Temperature in Tarija
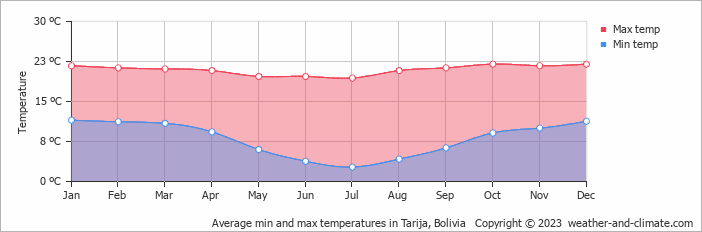
The climate in Tarija remains fairly constant, offering pleasant temperatures throughout the year. Average maximum daytime temperatures range from a comfortable 22°C (72°F) in October, the warmest time of the year, to a pleasant 19°C (66°F) during cooler months like July.
At night, you can expect temperatures ranging from 12°C (54°F) in October to around 3°C (37°F) during July.
Check out our detailed temperature page for more information.
Temperature ranges by month
Rainfall in Tarija
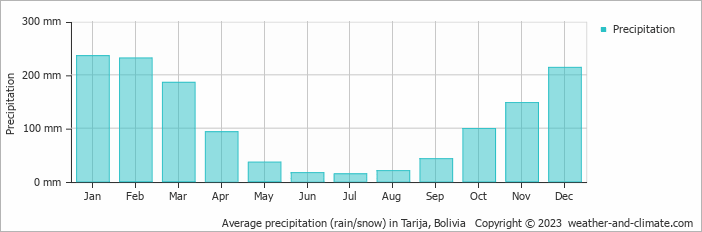
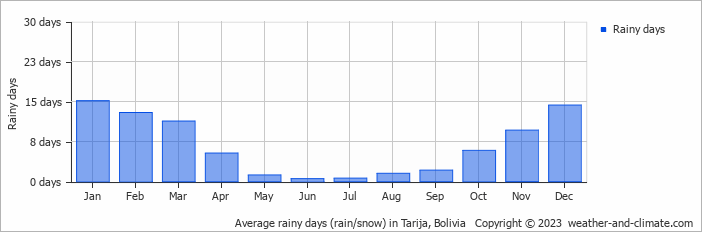
Tarija is known for its substantial rain/snowfall, with annual precipitation reaching 1335 mm (53 in). Significant seasonal changes in precipitation occur throughout the year. In the wettest month, January it receives heavy rainfall, averaging 236 mm (9.3 in) of precipitation, recorded across 15 rainy days. In contrast, the driest month July brings less rainfall, with 14 mm (0.6 in) over a single rainy day. For more details, please visit our Tarija Precipitation page.
The mean monthly precipitation over the year, including rain, hail, and snow
The average number of days each month with precipitation
Humidity in Tarija by Month
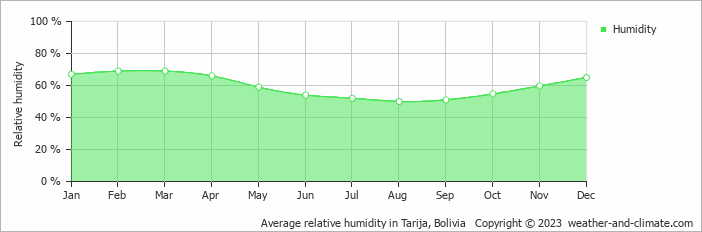
The relative humidity is moderate throughout the year in Tarija.
The city experiences its highest humidity in February, reaching 69%. In August, the humidity drops to its lowest level at 50%. What does this mean? Read our detailed page on humidity levels for further details.
Relative humidity over the year
Best Time to Visit Tarija
The weather does bring rainfall during this period, between 14 mm (0.6 in) and 99 mm (3.9 in).
Plan accordingly for January, February, March and December, when conditions bring the heaviest precipitation. Need help choosing your next travel destination? We offer a specialized tool that matches you with locations based on your weather preferences. Explore destinations that suit your climate preferences.
Frequently asked questions about the climate in Tarija
What is the best time to visit Tarija?
April, May, June, July, August, September and October typically offer the most optimal weather in Tarija. In contrast, January, February and December tend to have less optimal conditions. Tarija has distinct dry (May to August) and wet (December to March) seasons.
What temperatures can I expect in Tarija?
Daytime highs range from 19°C (66°F) in July to 22°C (72°F) in October. Nighttime lows range from 3°C (37°F) to 12°C (54°F). Temperatures stay relatively stable year-round.
How much rain does Tarija get?
Annual rainfall is around 1335 mm (53 in). January is the wettest month with 236 mm (9.3 in), while July is the driest with 14 mm (0.6 in).
Tarija 3-Day Forecast
Tarija 3-Day Forecast
Tarija on the map
Tarija is highlighted — select any city to see its climate.
Popular this month
Where to go in July — average daytime high across popular destinations.
Bucket list
Need travel inspiration? Check out our bucket list articles and be inspired.
 The 10 most alternative cities in South America
Discover South America's top 10 alternative cities! From Valparaíso's vibrant streets to La Paz's high-altitude charm and Medellín's innovative spirit.
 The best place in Bolivia to spot a jaguar
Bolivia is a beautiful country for spotting animals. The chance that you will see a jaguar is very likely if you go to the right places.
Madidi National Park: a must-visit for nature lovers
Explore Bolivia's biodiverse Madidi National Park, with untouched wilderness from snow-capped peaks to Amazonian rainforest.
The Witches' Market of La Paz
Discover the Witches' Market in La Paz, where Andean magic meets tradition. Explore mystical rituals, herbal remedies, and sacred offerings to Pachamama.