Rabaul Weather & Climate: Best Time to Visit
Average temperatures, rainfall, sunshine and the best time to visit Rabaul.
Climate overview of Rabaul
Rabaul, Papua New Guinea, enjoys a steady climate throughout the year, with daytime temperatures typically around 29°C (84°F). November is the warmest month at 30°C (86°F), while August is the coolest at 29°C (84°F).
With around 2778 mm (109 in) of annual rainfall, Rabaul has a notably wet climate. However, this rainfall is not evenly distributed — the city has a distinct rainy season from November to May. The wettest month is March. The sunniest month is June, with 7.0 hours of sunshine per day on average.
Rabaul Weather by Month
Pick a month to see the average temperature, rainfall and sunshine in Rabaul — and find the best time to visit.
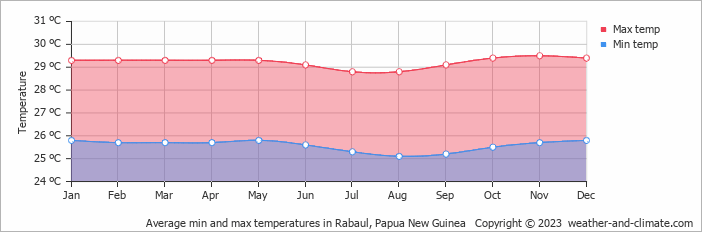
Monthly Temperature in Rabaul
The temperature in Rabaul remains steady throughout the year, providing a consistently comfortable climate. Average daytime temperatures reach a comfortable 30°C (86°F) in November. In August, the coolest month of the year, temperatures drop to a comfortable 29°C (84°F).
At night, temperatures range from around 26°C (79°F) in November to 25°C (77°F) in August.
Check out our detailed temperature page for more information.
Temperature ranges by month
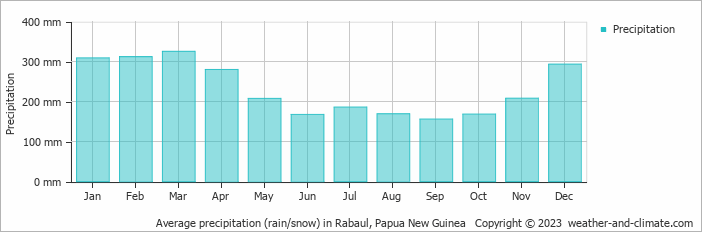
Rainfall in Rabaul
Rabaul has a relatively rainy climate with high precipitation levels, averaging 2778 mm (109 in) of rainfall annually. Rabaul experiences moderate seasonal variation in rainfall, with monthly averages ranging from 325 mm (13 in) in March, the wettest month, and 156 mm (6.1 in) in September, the driest month. For more details, please visit our Rabaul Precipitation page.
The mean monthly precipitation over the year, including rain, hail, and snow
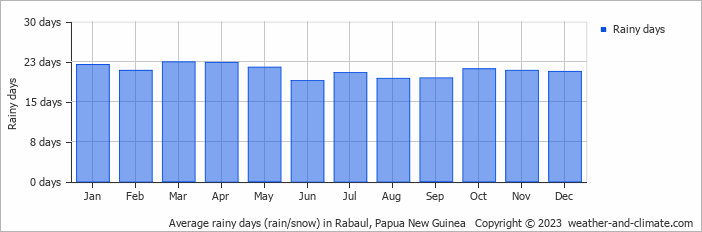
The average number of days each month with precipitation
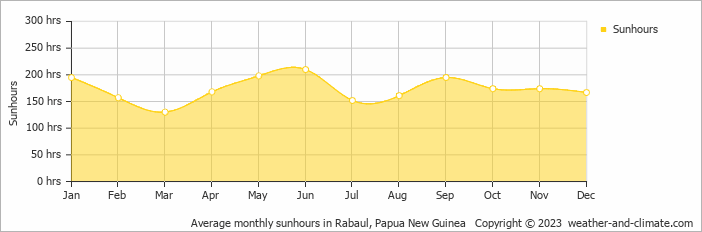
Sunshine Hours in Rabaul
Rabaul experiences moderate variation in sunshine hours across the seasons. With 7.0 hours daily sunshine in June, it dips to 4.3 hours in March, offering a balanced mix of sunny and overcast days.
Visit our detailed sunshine hours page for more information.
Monthly hours of sunshine
Daily hours of sunshine
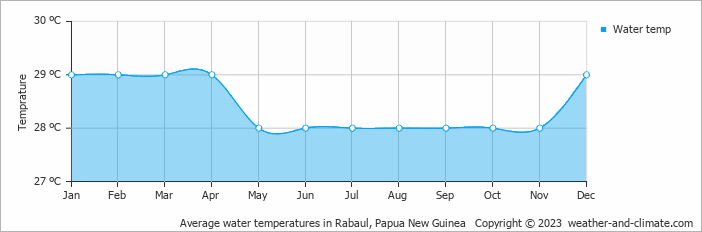
Water Temperature in Rabaul
The mean water temperature over the year ranges from 28°C (82°F) in May to 29°C (84°F) in January.
Water temperature over the year
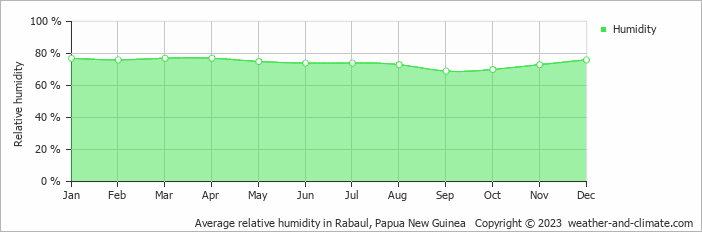
Humidity in Rabaul by Month
The relative humidity is high throughout the year in Rabaul.
The city experiences its highest humidity in January, reaching 77%. In September, the humidity drops to its lowest level at 69%. What does this mean? Read our detailed page on humidity levels for further details.
Relative humidity over the year
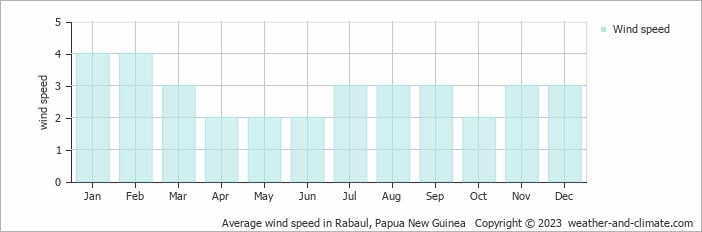
Wind Speed in Rabaul
The mean wind speed over the year ranges from 2 m/s (4 knots) in April, May, June and October to 4 m/s (8 knots) in January and February. What does this mean?
The mean monthly wind speed over the year (meters per second)
Best Time to Visit Rabaul
For a more comfortable experience, start your day early when the weather is cooler, or take advantage of the gentle breezes in the late afternoon. Planning your next adventure but unsure where to go? Our climate tool suggests perfect locations tailored to your preferred weather conditions. Discover your ideal travel destination with our weather planner.
Frequently asked questions about the climate in Rabaul
What is the best time to visit Rabaul?
June, August, September and October typically offer the most optimal weather in Rabaul. In contrast, January, February, March, April, November and December tend to have less optimal conditions. Rabaul has a distinct rainy season from November to May.
What temperatures can I expect in Rabaul?
Daytime highs range from 29°C (84°F) in August to 30°C (86°F) in November. Nighttime lows range from 25°C (77°F) to 26°C (79°F). Temperatures stay relatively stable year-round.
How much rain does Rabaul get?
Annual rainfall is around 2778 mm (109 in). March is the wettest month with 325 mm (13 in), while September is the driest with 156 mm (6.1 in).
How sunny is Rabaul?
Rabaul receives around 2,081 hours of sunshine per year. June is the sunniest month with 210 hours, while March is the cloudiest with just 130 hours. Overall, Rabaul enjoys abundant sunshine.
Rabaul 3-Day Forecast
Rabaul 3-Day Forecast
Rabaul on the map
Rabaul is highlighted — select any city to see its climate.
Popular this month
Where to go in June — average daytime high across popular destinations.