Hachijojima Weather & Climate: Best Time to Visit
Average temperatures, rainfall, sunshine and the best time to visit Hachijojima.
Climate overview of Hachijojima
Hachijojima, Japan, sees big temperature differences between seasons, with August peaking at 29°C (84°F) and February dropping to 16°C (61°F).
With around 2300 mm (91 in) of annual rainfall, Hachijojima has a notably wet climate. However, this rainfall is not evenly distributed — the city has a distinct rainy season from September to July. The wettest month is June. The sunniest month is August, with 6.2 hours of sunshine per day on average.
Hachijojima Weather by Month
Pick a month to see the average temperature, rainfall and sunshine in Hachijojima — and find the best time to visit.
Monthly Temperature in Hachijojima
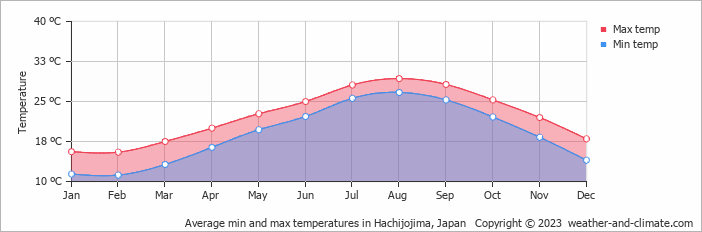
Visitors to Hachijojima can expect significant temperature changes throughout the year. Average daytime temperatures reach a comfortable 29°C (84°F) in August. In February, the coolest month of the year, temperatures drop to a moderate 16°C (61°F).
At night, temperatures range from around 27°C (81°F) in August to 11°C (52°F) in February.
Check out our detailed temperature page for more information.
Temperature ranges by month
Rainfall in Hachijojima
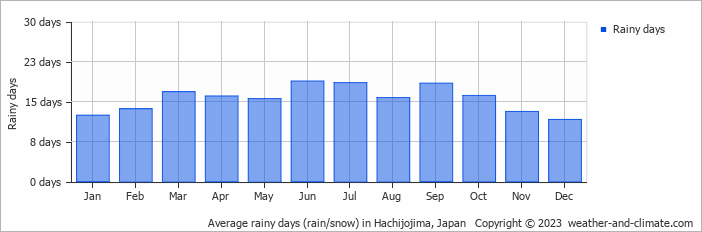
Hachijojima is known for its substantial rainfall, with annual precipitation reaching 2300 mm (91 in). Hachijojima can be quite wet during June, receiving approximately 323 mm (13 in) of precipitation over 19 rainy days.
In contrast, during the driest month (August), you will experience much drier conditions, with 116 mm (4.6 in) of precipitation spread across 16 rainy days days. For more details, please visit our Hachijojima Precipitation page.
The mean monthly precipitation over the year, including rain, hail, and snow

The average number of days each month with precipitation
Sunshine Hours in Hachijojima
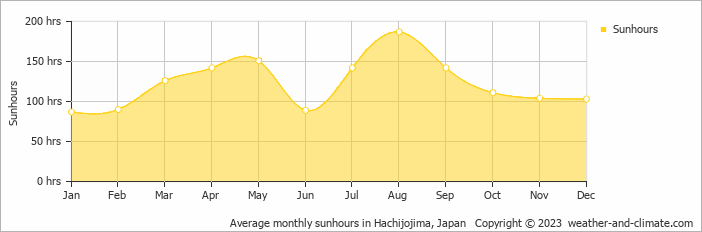
Hachijojima can be enjoyed more throughout the sunniest month of August under a blue sky, with approximately 6.2 hours of sunshine daily. In contrast, the city experiences much darker days in January, with only 2.9 hours of sunlight per day.
Visit our detailed sunshine hours page for more information.
Monthly hours of sunshine
Daily hours of sunshine
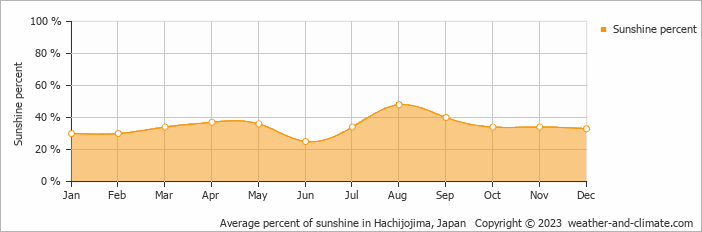
Daily percentage of sunshine
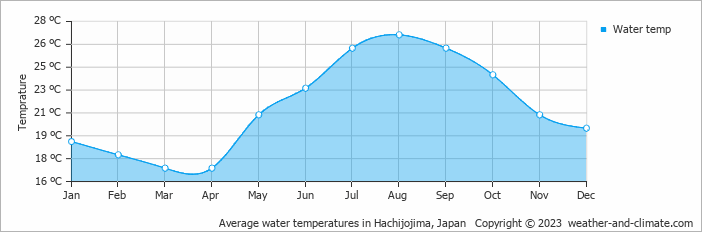
Water Temperature in Hachijojima
The mean water temperature over the year ranges from 17°C (63°F) in March to 27°C (81°F) in August.
Water temperature over the year
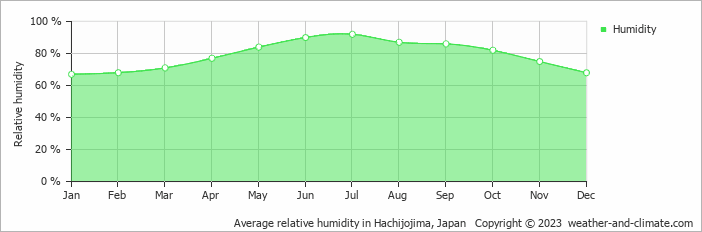
Humidity in Hachijojima by Month
The relative humidity is high throughout the year in Hachijojima.
The city experiences its highest humidity in July, reaching 92%. In January, the humidity drops to its lowest level at 67%. What does this mean? Read our detailed page on humidity levels for further details.
Relative humidity over the year
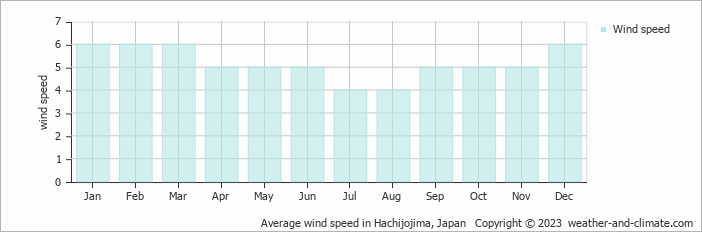
Wind Speed in Hachijojima
The average wind speed over the year ranges from 4 m/s (8 knots) to 6 m/s (12 knots). It is lower in July and August and higher in January, February, March and December. What does this mean?
The mean monthly wind speed over the year (meters per second)
Best Time to Visit Hachijojima
The weather does bring rainfall during this period, between 116 mm (4.6 in) and 153 mm (6 in).
Plan accordingly for February, March, May, June, July, September, October and November, when conditions bring the heaviest precipitation. Ready to plan your travels but need destination ideas? Our smart tool recommends places based on the climate conditions you prefer. Start planning with our destination weather tool.
Frequently asked questions about the climate in Hachijojima
What is the best time to visit Hachijojima?
April, May, July and August typically offer the most optimal weather in Hachijojima. In contrast, June and October tend to have less optimal conditions. Hachijojima has a distinct rainy season from September to July.
What temperatures can I expect in Hachijojima?
Daytime highs range from 16°C (61°F) in February to 29°C (84°F) in August. Nighttime lows range from 11°C (52°F) to 27°C (81°F). Temperatures vary considerably through the year.
How much rain does Hachijojima get?
Annual rainfall is around 2300 mm (91 in). June is the wettest month with 323 mm (13 in), while August is the driest with 116 mm (4.6 in).
How sunny is Hachijojima?
Hachijojima receives around 1,474 hours of sunshine per year. August is the sunniest month with 187 hours, while January is the cloudiest with just 87 hours.
Hachijojima 3-Day Forecast
Hachijojima 3-Day Forecast
Hachijojima on the map
Hachijojima is highlighted — select any city to see its climate.
Popular this month
Where to go in July — average daytime high across popular destinations.
Bucket list
Need travel inspiration? Check out our bucket list articles and be inspired.
 Chase the autumn leaves in Japan
Japan is one of these cases which turns into a gold, yellow and orange fairy tale starting from September. And we can honestly say: We cannot imagine a more beautiful season to visit Japan.
Walk the 88 temple circuit
We recommend walking the 88 temple circuit from April til October. Although June, July and August can be a bit wet, hot and humid.
The famous bamboo forests of Arashiyama
The famous bamboo forests of Arashiyama lie just outside the city center of Kyoto and is unique in the world. If you look at photos of this bamboo forest, it looks like you have landed in a fairy-tale world.
10 reasons why you should visit Japan in winter
Here are 10 reasons why you should plan a winter trip to Japan. During this period, popular sights are less busy and prices for flights and hotels much cheaper.