Bahía Blanca Weather & Climate: Best Time to Visit
Average temperatures, rainfall, sunshine and the best time to visit Bahía Blanca.
Climate overview of Bahía Blanca
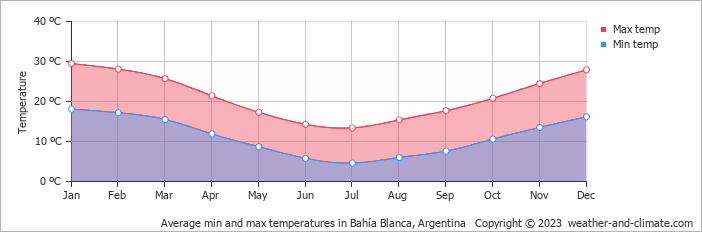
Temperatures in Bahía Blanca, Buenos Aires Province, Argentina, vary greatly throughout the year. January is the hottest month at 30°C (86°F), while July is the coldest at 13°C (55°F).
With around 646 mm (25 in) of annual rainfall, the city has moderate precipitation levels. February is the wettest month and June the driest. It also has a distinct dry season from June to August. The most sunshine falls in January, with an average of 10.0 hours of daily sunshine.
Bahía Blanca Weather by Month
Pick a month to see the average temperature, rainfall and sunshine in Bahía Blanca — and find the best time to visit.
Monthly Temperature in Bahía Blanca
The climate in Bahía Blanca is known for significant temperature differences throughout the year, making the weather dynamic. Typically, average maximum daytime temperatures range from a comfortable 30°C (86°F) in January to a moderate 13°C (55°F) in the coolest month, July.
Nights vary from 18°C (64°F) in January to around 5°C (41°F) during the colder months.
Check out our detailed temperature page for more information.
Temperature ranges by month
Rainfall in Bahía Blanca
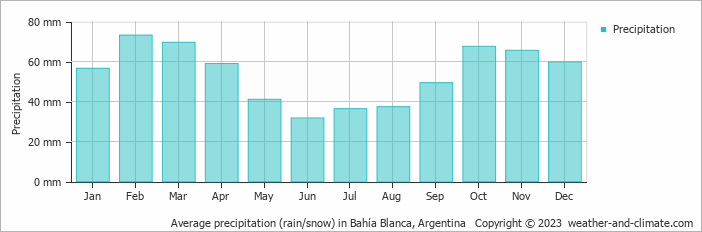
Generally, Bahía Blanca receives mid-range precipitation levels, with 646 mm (25 in) annually. The climate in Bahía Blanca shows significant variation throughout the year. Expect moderate rainfall in February, the wettest month, with an average of 73 mm (2.9 in) of precipitation over 6 rainy days.
In contrast, the driest month June offers drier and sunnier days, with around 32 mm (1.3 in) of rainfall over 5 rainy days. For more details, please visit our Bahía Blanca Precipitation page.
The mean monthly precipitation over the year, including rain, hail, and snow
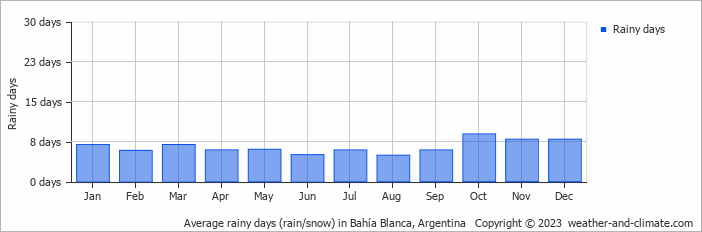
The average number of days each month with precipitation
Sunshine Hours in Bahía Blanca
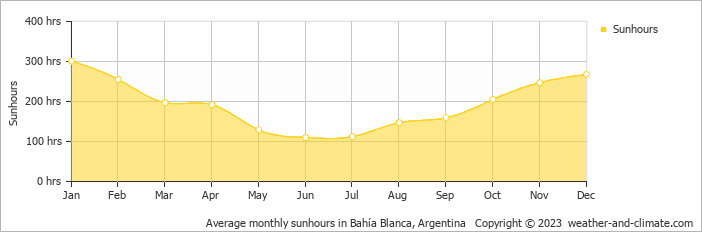
For those who appreciate different seasons, Bahía Blanca serves as an ideal destination. Expect longer, more sun-filled days in January with an average of 10.0 hours of sunshine daily, and embrace the darker days in June, offering only 3.7 hours of daily sunlight.
Visit our detailed sunshine hours page for more information.
Monthly hours of sunshine
Daily hours of sunshine
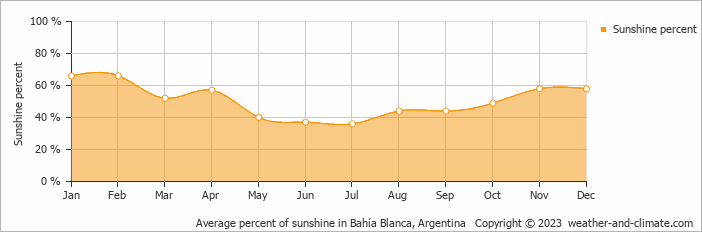
Daily percentage of sunshine
Water Temperature in Bahía Blanca
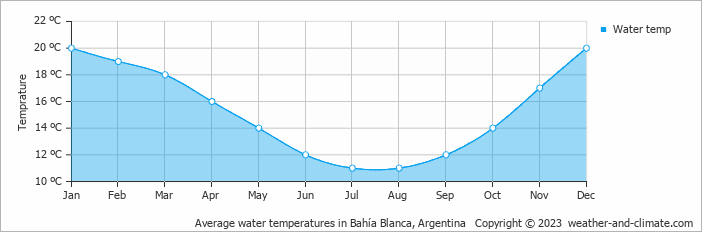
The mean water temperature over the year ranges from 11°C (52°F) in July to 20°C (68°F) in January.
Water temperature over the year
Humidity in Bahía Blanca by Month
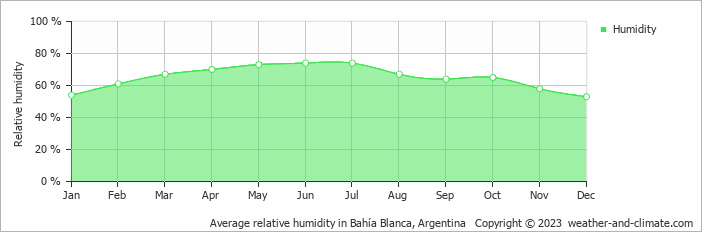
The relative humidity is high throughout the year in Bahía Blanca.
The city experiences its highest humidity in June, reaching 74%. In December, the humidity drops to its lowest level at 53%. What does this mean? Read our detailed page on humidity levels for further details.
Relative humidity over the year
Best Time to Visit Bahía Blanca
Frequently asked questions about the climate in Bahía Blanca
What is the best time to visit Bahía Blanca?
February, March, April, October, November and December typically offer the most optimal weather in Bahía Blanca. In contrast, July tends to have less optimal conditions. Bahía Blanca has a distinct dry season from June to August.
What temperatures can I expect in Bahía Blanca?
Daytime highs range from 13°C (55°F) in July to 30°C (86°F) in January. Nighttime lows range from 5°C (41°F) to 18°C (64°F). Temperatures vary considerably through the year.
How much rain does Bahía Blanca get?
Annual rainfall is around 646 mm (25 in). February is the wettest month with 73 mm (2.9 in), while June is the driest with 32 mm (1.3 in).
How sunny is Bahía Blanca?
Bahía Blanca receives around 2,322 hours of sunshine per year. January is the sunniest month with 301 hours, while June is the cloudiest with just 110 hours. Overall, Bahía Blanca enjoys abundant sunshine.
Bahía Blanca 3-Day Forecast
Bahía Blanca 3-Day Forecast
Bahía Blanca on the map
Bahía Blanca is highlighted — select any city to see its climate.
Popular this month
Where to go in July — average daytime high across popular destinations.
Bucket list
Need travel inspiration? Check out our bucket list articles and be inspired.
 The 10 most alternative cities in South America
Discover South America's top 10 alternative cities! From Valparaíso's vibrant streets to La Paz's high-altitude charm and Medellín's innovative spirit.
Be amazed by Buenos Aires
The city of beautiful museums, cute streets, green parks, lots of good food, interesting local neighborhoods and impressive historical buildings.
Explore Patagonia
A tour through Patagonia brings you to the end of the world. That’s why Patagonia is a bucket list destination for many. We recommend to visit Patagonia from November to early March.
Glacier walk on The Perito Moreno glacier
The Perito Moreno glacier and the rupture of this glacier is considered one of the most impressive natural spectacles in the world. You can wait here until a large piece of ice crumbles and plunges into the water with a lot of noise.