


















 The 10 most charming villages in France
Discover France's top 10 beautiful villages. From Normandy to the Côte d'Azur, experience quaint squares and cobbled streets. Which one will you visit this summer?
On this page you find more information about the monthly relative humidity over the year in La Londe-les-Maures (Provence-Alpes-Côte d'Azur), France.
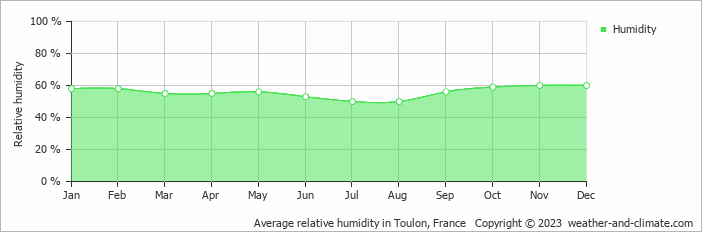
La Londe-les-Maures's humidity levels vary throughout the year. The highest levels occur in November, reaching 60% (high), while the lowest is recorded in July at 50%.
Throughout the year, the average humidity in La Londe-les-Maures is 56%.
Humidity plays an important role in how temperatures are felt. During the warmest month, August, the maximum average temperature is around 30°C (86°F). During this warm period, the moderate humidity levels have little impact on how the temperature is perceived.
During the coldest month, January, the maximum average temperature is around 13°C (55°F). This period has moderate humidity. Check out our detailed temperature page for more information.
Pick a month to see the average temperature, rainfall and sunshine in La Londe-les-Maures - and find the best time to visit.
Temperature Rainfall Sunshine Humidity Water Temp
See the full La Londe-les-Maures climate overview or explore weather in France.
Where to go in October - average daytime high across popular destinations.
Need travel inspiration? Check out our bucket list articles and be inspired.
The 10 most charming villages in France
Discover France's top 10 beautiful villages. From Normandy to the Côte d'Azur, experience quaint squares and cobbled streets. Which one will you visit this summer?
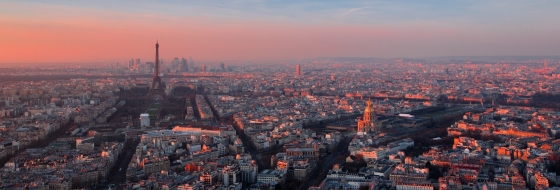 An alternative way to discover Paris
From street art, vintage shops, vegetarian cafes, to amazing cultural events, Paris has much to offer for the creative traveler. An overview of sights that you must see if you want to visit this city in an alternative way.
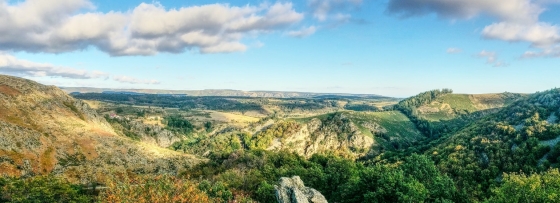 Nature is allowed to take its course in the Ardeche
The Ardèche is France at its most beautiful. The authentic villages and breathtaking mountainous landscapes are one of the main reasons. he climate in Ardèche is very pleasant. Temperatures are high during summer and it is often very sunny.

 Explore the natural wonders of Corsica
Corsica offers an abundance of incredible natural wonders to explore. This stunning Mediterranean island is a paradise for outdoor enthusiasts and nature lovers alike.