
















 Visit the Rainbow Mountains
The Rainbow Mountain (Vinicunca) is acolored rainbow mountain that will steal your heart forever and the view from the top will take your breath away.
September in Yanque sees daytime temperatures around 14°C (57°F) and lows of -1°C (30°F) at night. Pack a rain jacket because some snow/rainfall is likely.
So this is a great month to visit if you prefer dry days with pleasant temperatures.
 Min Temperature
Max Temperature
Min Temperature
Max Temperature
 Chance of Rain
Precipitation
Rainy days
Chance of Rain
Precipitation
Rainy days
Pick a month to see the average temperature, rainfall and sunshine in Yanque - and find the best time to visit.
50-year average (1976-2025)
Based on our historical records, temperatures in Yanque typically stay consistent throughout September, with daily highs averaging around 14°C (57°F). Nights are cold, with lows around 8°C (46°F).
Browse day-by-day weather records for Yanque spanning 51 years. Select any month and year to see actual temperatures, rainfall, and conditions recorded on each day.
Based on weather observations in Yanque between 1991 and 2025, these are the recorded extremes during September.
Find out more about the weather in Peru and which places have the best travel conditions in this month. See all of Peru in September →
Perfect weather is subjective. On this map perfect weather has been defined with temperatures between 20°C (68°F) and 29°C (84°F) and not too much precipitation (less than 90 mm (3.5 in) a month).
The weather can be unpredictable in September, so pack clothes you can easily mix and match. You could bring jeans, other long pants, and a few t-shirts. A light jacket or light sweater will be pleasant for the cooler moments. Rain is likely on several days, so bring a good rain jacket.
We rated the following activities from 1 (least suitable) to 10 (best) to do.


See the full Yanque climate overview or explore weather in Peru.
Where to go in September - average daytime high across popular destinations.
Iquitos 32°C (90°F) Trujillo
 22°C (72°F) Lima20°C (68°F) Arequipa
 20°C (68°F) Puno17°C (63°F) Cusco
 17°C (63°F) Machu Picchu15°C (59°F) Urubamba14°C (57°F)
 Need travel inspiration? Check out our bucket list articles and be inspired.
Visit the Rainbow Mountains
The Rainbow Mountain (Vinicunca) is acolored rainbow mountain that will steal your heart forever and the view from the top will take your breath away.
 "The other" Machu Picchu: the Inca City of Choquequirao
Discover Choquequirao, the hidden Inca city near Cusco. Hike through stunning landscapes and explore ancient ruins with fewer crowds than Machu Picchu.
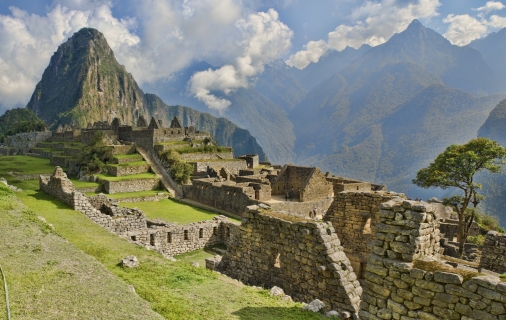 Hike the inca Trail
Few walking tours speak so much to the imagination as the Inca Trail to Machu Picchu. The tour leads through beautiful mountain landscapes and it is called the 'Royal Highway'
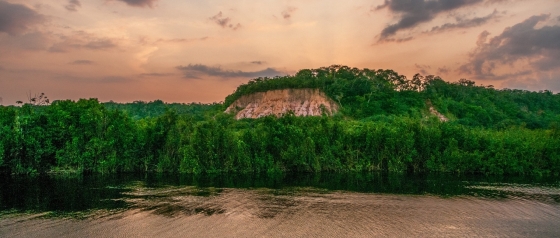 The Inkaterra Reserva Amazonica
One of your highlights during a trip in Peru might be this eco-luxury lodge in front of the Madre de Dios River, called Inkaterra Reserva Amazonica.