















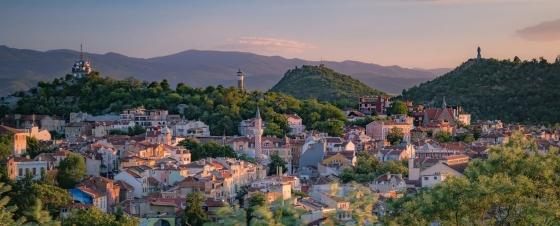
 7 of the most budget-friendly destinations in Europe
Discover Europe's top budget-friendly destinations including Budapest, Kotor, Krakow, and more, perfect for affordable and exciting travel.
October in Vrchlabí typically sees daytime highs of 12°C (54°F) and nighttime lows of 4°C (39°F). Rainfall is also possible this month, so it's worth packing an umbrella.
If you prefer enjoying temperate temperatures and rain-free days, August typically offers the best circumstances. If you're seeking pleasant, dry and sunny weather somewhere else in the world, our weather planner can help you explore other options.
 Min Temperature
Max Temperature
Min Temperature
Max Temperature
 Chance of Rain
Precipitation
Rainy days
Chance of Rain
Precipitation
Rainy days
 Humidity
 Sunshine
Percentage Sunshine
Sunshine
Percentage Sunshine
Pick a month to see the average temperature, rainfall and sunshine in Vrchlabí - and find the best time to visit.
50-year average (1976-2025)
Based on our historical records, temperatures in Vrchlabí typically drop from around 12°C (54°F) at the start of October to approximately 8°C (46°F) by the end. Nights are cold, with lows typically ranging from 0°C (32°F) to 4°C (39°F).
50-year average (1976-2025)
Average daily rainfall for each day of the month based on long-term records.
Browse day-by-day weather records for Vrchlabí spanning 51 years. Select any month and year to see actual temperatures, rainfall, and conditions recorded on each day.
Based on weather observations in Vrchlabí between 1976 and 2025, these are the recorded extremes during October.
Find out more about the weather in Czech Republic and which places have the best travel conditions in this month. See all of Czech Republic in October →
Perfect weather is subjective. On this map perfect weather has been defined with temperatures between 20°C (68°F) and 29°C (84°F) and not too much precipitation (less than 90 mm (3.5 in) a month).
The weather can be unpredictable in October, so pack clothes you can easily mix and match. You could bring jeans, other long pants, and a few t-shirts. A light jacket or light sweater will be pleasant for the cooler moments. Rain is likely on several days, so bring a good rain jacket. It won't hurt to bring your sunglasses along, as you'll see some sunny periods.
We rated the following activities from 1 (least suitable) to 10 (best) to do.


Temperature Rainfall Sunshine Humidity
See the full Vrchlabí climate overview or explore weather in Czech Republic.
Where to go in October - average daytime high across popular destinations.
 Prague
 14°C (57°F) Brno
 14°C (57°F) Mariánské Lázně13°C (55°F) Český Krumlov13°C (55°F) Rokytnice nad Jizerou11°C (52°F) Karlovy Vary
 12°C (54°F) Špindlerův Mlýn11°C (52°F) Harrachov11°C (52°F)
 Need travel inspiration? Check out our bucket list articles and be inspired.
7 of the most budget-friendly destinations in Europe
Discover Europe's top budget-friendly destinations including Budapest, Kotor, Krakow, and more, perfect for affordable and exciting travel.
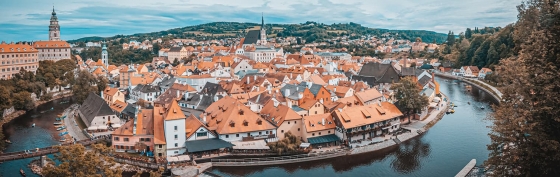 A magical trip to the fairytale town of Cesky Krumlov
Cesky Krumlov is as magical and beautiful as a storybook one. If you love castles and cobbled streets, this town is perfect for a getaway for you.
 Karlovy Vary: The Timeless Elegance of a Premier Spa Town
Karlovy Vary, a historic spa town in Bohemia known for its elegant 19th-century architecture, famous hot springs, and rich cultural heritage.

 The 10 most charming villages in France
Discover France's top 10 beautiful villages. From Normandy to the Côte d'Azur, experience quaint squares and cobbled streets. Which one will you visit this summer?