














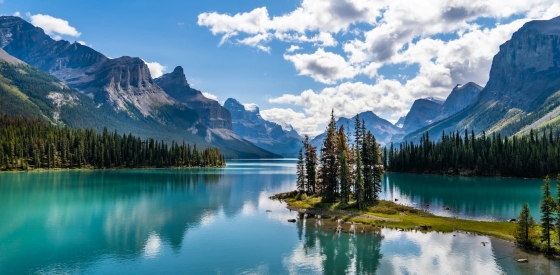
 The 5 most beautiful lakes in Canada
Explore Canada's stunning lakes: Lake Louise, Lake Superior, Maligne Lake, Emerald Lake, and Lake Okanagan, each offering unique beauty and activities.
During November, Vancouver experiences low daytime temperatures of 9°C (48°F) and cooler nights around 4°C (39°F). As the wettest month of the year, expect frequent rainfall.
November in Vancouver has its charm. However, if you're seeking pleasant, dry and sunny weather, our weather planner can help you explore other destinations in the world.
 Min Temperature
Max Temperature
Min Temperature
Max Temperature
 Chance of Rain
Precipitation
Rainy days
Chance of Rain
Precipitation
Rainy days
 Humidity
 Sunshine
Percentage Sunshine
Sunshine
Percentage Sunshine
Pick a month to see the average temperature, rainfall and sunshine in Vancouver - and find the best time to visit.
50-year average (1976-2025)
Based on our historical records, temperatures in Vancouver typically drop from around 11°C (52°F) at the start of November to approximately 7°C (45°F) by the end. Nights are cold, with lows typically ranging from 2°C (36°F) to 6°C (43°F).
50-year average (1976-2025)
Average daily rainfall for each day of the month based on long-term records.
Browse day-by-day weather records for Vancouver spanning 51 years. Select any month and year to see actual temperatures, rainfall, and conditions recorded on each day.
Based on 49 years of weather observations (1976-2025), these are the most extreme conditions recorded in Vancouver.
Find out more about the weather in Canada and which places have the best travel conditions in this month. See all of Canada in November →
Perfect weather is subjective. On this map perfect weather has been defined with temperatures between 20°C (68°F) and 29°C (84°F) and not too much precipitation (less than 90 mm (3.5 in) a month).
Dress warmly and in layers for your trip to Vancouver in November. A good base layer system works wonders. Start with good thermal underwear, add something warm like a fleece sweater, then finish with a waterproof jacket on top. It's going to pour! Pack a good poncho and prepare for very wet conditions. With limited sunshine expected, sunglasses aren't a priority for packing.
We rated the following activities from 1 (least suitable) to 10 (best) to do.


Temperature Rainfall Sunshine Humidity
See the full Vancouver climate overview or explore weather in Canada.
Where to go in November - average daytime high across popular destinations.
Need travel inspiration? Check out our bucket list articles and be inspired.
The 5 most beautiful lakes in Canada
Explore Canada's stunning lakes: Lake Louise, Lake Superior, Maligne Lake, Emerald Lake, and Lake Okanagan, each offering unique beauty and activities.
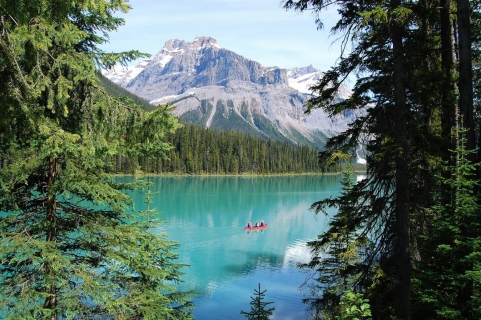 Canada in September: Where Is the Best Weather?
Compare September weather in Toronto, Montreal, Vancouver, Quebec City and Osoyoos to find Canada's warmest, driest and sunniest destinations.
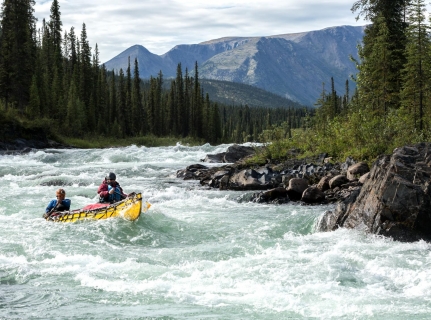 Canoeing the south Nahannii
The South Nahanni in the northwest of Canada is one of the most impressive wilderness rivers in the world. Canoeing the south Nahanni is something you must add to your bucket list.
 See Polar Bears in Churchill Canada
Thousands of bears gather at the small town of Churchill. In the evening the northern lights give a light show against the dark evening sky. An unforgettable experience.