









 Do a pub crawl in Antwerp
You can visit Antwerp year round however May through September is the best time to go to Antwerp for a pub crawl. Late spring is recommended for its long days.
August in Rendeux brings high temperatures, with highs of 23°C (73°F) and nights dropping to 12°C (54°F). Rainfall is on the higher side this month, averaging around 92 mm (3.6 in), so keep a rain jacket handy.
So this is a great month to visit if you prefer dry days with pleasant temperatures.
 Min Temperature
Max Temperature
 Chance of Rain
Precipitation
Rainy days
 Humidity
 Sunshine
Percentage Sunshine
Pick a month to see the average temperature, rainfall and sunshine in Rendeux - and find the best time to visit.
50-year average (1976-2025)
Based on our historical records, temperatures in Rendeux typically stay consistent throughout August, with daily highs averaging around 23°C (73°F). Nights are cool, with lows typically ranging from 11°C (52°F) to 13°C (55°F).
50-year average (1976-2025)
Average daily rainfall for each day of the month based on long-term records.
Browse day-by-day weather records for Rendeux spanning 51 years. Select any month and year to see actual temperatures, rainfall, and conditions recorded on each day.
Our historical data for Rendeux spans 1976 to 2026, revealing these weather extremes.
Find out more about the weather in Belgium and which places have the best travel conditions in this month. See all of Belgium in August →
Perfect weather is subjective. On this map perfect weather has been defined with temperatures between 20°C (68°F) and 29°C (84°F) and not too much precipitation (less than 90 mm (3.5 in) a month).
Comfortable temperatures call for an easy wardrobe in August. Pack summer basics like t-shirts and shorts, but include a light jacket for cooler moments. A pair of comfortable walking shoes is essential. Expect heavy rainfall, so bring good rain protection and waterproof bags. It won't hurt to bring your sunglasses along, as you'll see some sunny periods.
We rated the following activities from 1 (least suitable) to 10 (best) to do.


Temperature Rainfall Sunshine Humidity
See the full Rendeux climate overview or explore weather in Belgium.
Where to go in August - average daytime high across popular destinations.
Need travel inspiration? Check out our bucket list articles and be inspired.
Do a pub crawl in Antwerp
You can visit Antwerp year round however May through September is the best time to go to Antwerp for a pub crawl. Late spring is recommended for its long days.
 Discover the green beauty of Belgium's Ardennes
Uncover Belgium's Ardennes: Outdoor adventures, history, relaxation, and local delights await in this green travel paradise
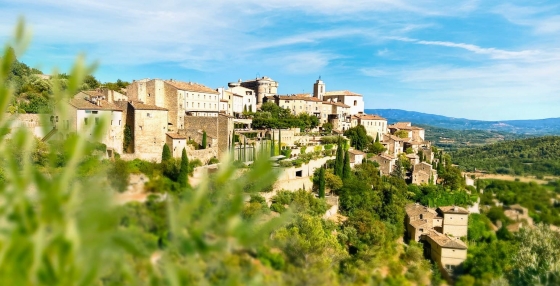
 The 10 most charming villages in France
Discover France's top 10 beautiful villages. From Normandy to the Côte d'Azur, experience quaint squares and cobbled streets. Which one will you visit this summer?
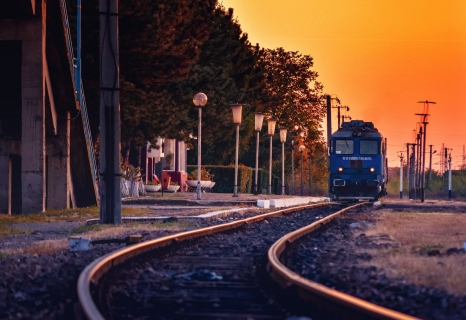
 The train journey from Bucharest to Brasov is one of the most beautiful in Romania
In three hours, you'll get from Bucharest to Brasov by train. It is one of the most beautiful routes in Romania, certainly the most beautiful that can be done by express train.