
















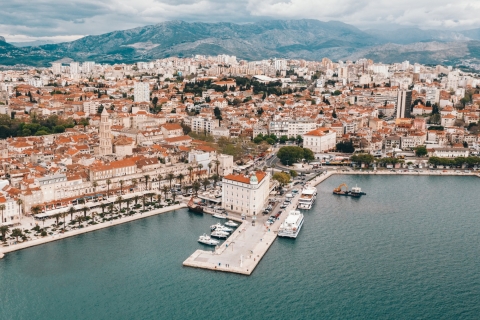
 Magical Split
The best travel time to Split in Croatia is from May til October and the best months are May, June and September.
November in Murvica typically sees daytime highs of 15°C (59°F) and nighttime lows of 9°C (48°F). As the wettest month of the year, expect more rainfall than other months.
Our weather planner can help you find worldwide destinations with pleasant weather during this period. May and June typically offer the best weather for Murvica.
 Min Temperature
Max Temperature
Water Temperature
Min Temperature
Max Temperature
Water Temperature
 Chance of Rain
Precipitation
Rainy days
Chance of Rain
Precipitation
Rainy days
 Humidity
 Sunshine
Percentage Sunshine
Sunshine
Percentage Sunshine
Pick a month to see the average temperature, rainfall and sunshine in Murvica - and find the best time to visit.
Find out more about the weather in Croatia and which places have the best travel conditions in this month. See all of Croatia in November →
Perfect weather is subjective. On this map perfect weather has been defined with temperatures between 20°C (68°F) and 29°C (84°F) and not too much precipitation (less than 90 mm (3.5 in) a month).
Pack for changing conditions in Murvica in November. Bring a mix of short and long sleeves, a warm layer like a hoodie or light jacket, and comfortable pants. The key is being able to add or remove layers as the days goes by. Heavy rain is guaranteed, please bring a good poncho and waterproof everything! Expect water temperatures of around 18°C (64°F), which is definitely too cold for comfortable swimming. Your luggage space is better used for other items. Sunglasses could come in handy during the sunnier parts of your trip.
We rated the following activities from 1 (least suitable) to 10 (best) to do.


Temperature Rainfall Sunshine Humidity Water Temp
See the full Murvica climate overview or explore weather in Croatia.
Where to go in November - average daytime high across popular destinations.
Need travel inspiration? Check out our bucket list articles and be inspired.
Magical Split
The best travel time to Split in Croatia is from May til October and the best months are May, June and September.
 Sail the crystal-clear waters of Croatia and enjoy its stunning coastline
Croatia is an idyllic sailing destination, boasting 1,777 miles (2,860 km) of beautiful beaches and pristine waters. With over 1,000 Islands dotting the Adriatic Sea, there's a perfect spot for everyone.
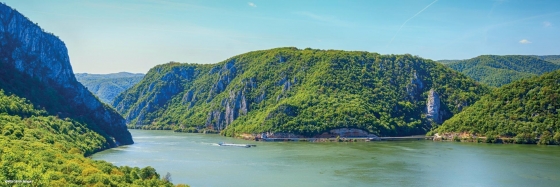
 Cycle the Danube trail
The Danube cycle route is one of the most popular cycling routes in Europe, and rightly so, because it is a varied route that is interesting both in terms of culture and nature.

 The 10 most charming villages in France
Discover France's top 10 beautiful villages. From Normandy to the Côte d'Azur, experience quaint squares and cobbled streets. Which one will you visit this summer?