


















 Costa Rica in February: Pacific or Caribbean Coast?
Compare Costa Rica weather in February, from dry and sunny Tamarindo to wetter Puerto Viejo, plus Jacó, Arenal and San José.
During August, Herradura experiences high daytime temperatures of 28°C (82°F) and cooler nights around 24°C (75°F). August sits within the rainy season, so expect regular and often heavy rainfall.
August in Herradura has its charm. However, if you're seeking pleasant, dry and sunny weather, our weather planner can help you explore other destinations in the world.
 Min Temperature
Max Temperature
Min Temperature
Max Temperature
 Chance of Rain
Precipitation
Rainy days
Chance of Rain
Precipitation
Rainy days
 Sunshine
Percentage Sunshine
Sunshine
Percentage Sunshine
Pick a month to see the average temperature, rainfall and sunshine in Herradura - and find the best time to visit.
43-year average (1976-2025)
Based on our historical records, temperatures in Herradura typically stay consistent throughout August, with daily highs averaging around 28°C (82°F). Nights are pleasant, with lows around 19°C (66°F).
43-year average (1976-2025)
Average daily rainfall for each day of the month based on long-term records.
Browse day-by-day weather records for Herradura spanning 51 years. Select any month and year to see actual temperatures, rainfall, and conditions recorded on each day.
Based on weather observations in Herradura between 1996 and 2026, these are the recorded extremes during August.
Find out more about the weather in Costa Rica and which places have the best travel conditions in this month. See all of Costa Rica in August →
Perfect weather is subjective. On this map perfect weather has been defined with temperatures between 20°C (68°F) and 29°C (84°F) and not too much precipitation (less than 90 mm (3.5 in) a month).
Warm weather calls for comfortable, breathable clothing in August. Cotton t-shirts, shorts, light dresses, and sandals are perfect. You might still want a light layer for evenings or air-conditioned places (for example buses). Also bring a poncho, it will rain a lot! Waterproof everything you can. Sunglasses could come in handy during the sunnier parts of your trip.
See the full Herradura climate overview or explore weather in Costa Rica.
Where to go in August - average daytime high across popular destinations.
Tamarindo 31°C (88°F) Cahuita29°C (84°F) Santa Teresa29°C (84°F) Herradura28°C (82°F) Puerto Viejo de Talamanca29°C (84°F) Fortuna28°C (82°F) Jacó28°C (82°F) San José24°C (75°F)
 Need travel inspiration? Check out our bucket list articles and be inspired.
Costa Rica in February: Pacific or Caribbean Coast?
Compare Costa Rica weather in February, from dry and sunny Tamarindo to wetter Puerto Viejo, plus Jacó, Arenal and San José.
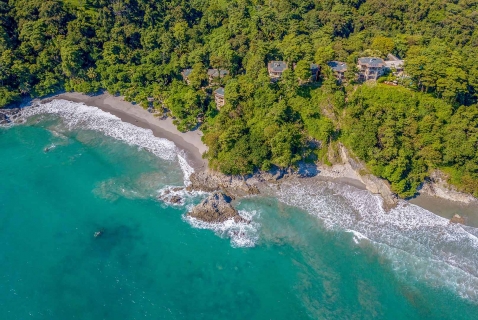 Where the rain forest meets the ocean
I promise that you will not find a better location, better views, nicer rooms or lovelier staff anywhere in Costa Rica. This place really goes above and beyond.
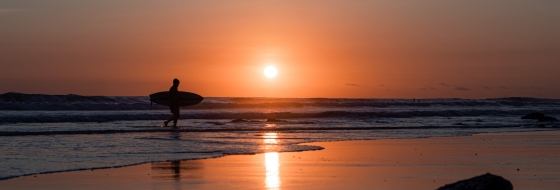 Exploring Santa Teresa, Costa Rica: A Traveler's Guide
Immerse yourself in the laid-back charm of Santa Teresa, Costa Rica. Discover stunning beaches, vibrant dining spots, unique shops, and diverse activities in our comprehensive guide
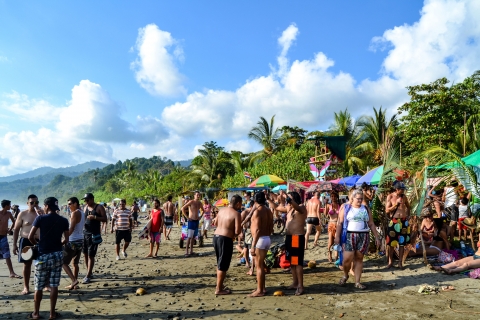 Envision Festival
This event happens once a year in Uvita de Puntarenas and attracts people from all over the world. This festival is a must add to your bucket list.