















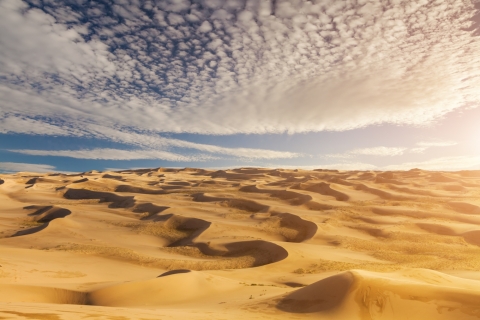
 See the Sahara in Tunisia
The best time to visit the Sahara is more towards the winter. This means more bearable temperatures in south of Tunisia.
With daytime temperatures of 22°C (72°F) and nighttime lows of 14°C (57°F), November in Harqalah brings high temperatures during the day. The excellent weather makes it an appealing time to visit.
So this is a great month to visit if you prefer dry days with pleasant temperatures.
 Min Temperature
Max Temperature
Min Temperature
Max Temperature
 Chance of Rain
Precipitation
Rainy days
Chance of Rain
Precipitation
Rainy days
Pick a month to see the average temperature, rainfall and sunshine in Harqalah - and find the best time to visit.
50-year average (1976-2025)
Based on our historical records, temperatures in Harqalah typically drop from around 24°C (75°F) at the start of November to approximately 19°C (66°F) by the end. Nights are cool, with lows typically ranging from 10°C (50°F) to 16°C (61°F).
50-year average (1976-2025)
Average daily rainfall for each day of the month based on long-term records.
Browse day-by-day weather records for Harqalah spanning 51 years. Select any month and year to see actual temperatures, rainfall, and conditions recorded on each day.
Based on weather observations in Harqalah between 1976 and 2025, these are the recorded extremes during November.
Find out more about the weather in Tunisia and which places have the best travel conditions in this month. See all of Tunisia in November →
Perfect weather is subjective. On this map perfect weather has been defined with temperatures between 20°C (68°F) and 29°C (84°F) and not too much precipitation (less than 90 mm (3.5 in) a month).
For Harqalah in November, you'll want flexible clothing. It's wise to pack cotton shirts, comfortable shorts, and a pair of jeans for cooler evenings. A light sweater or jacket is useful for air-conditioned spaces (like buses) or unexpected cool moments. Some rain is possible, so pack something to handle light showers.
We rated the following activities from 1 (least suitable) to 10 (best) to do.


See the full Harqalah climate overview or explore weather in Tunisia.
Where to go in November - average daytime high across popular destinations.
Need travel inspiration? Check out our bucket list articles and be inspired.
See the Sahara in Tunisia
The best time to visit the Sahara is more towards the winter. This means more bearable temperatures in south of Tunisia.
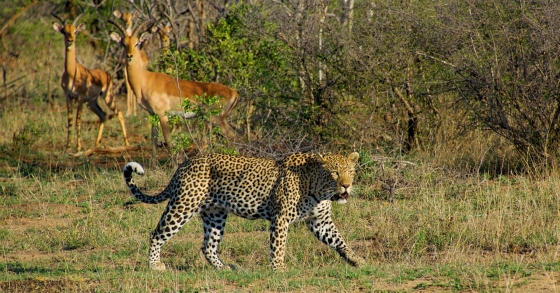
 Visit Kruger Park in South Africa
Are you going to South Africa, then you cannot skip the Kruger Park. The Kruger Park is one of the most beautiful and largest safari parks in the world.
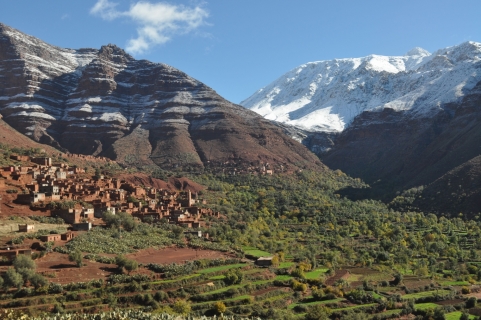
 The Atlas Mountains in Morocco
This mountain range is the second highest mountains in the world and is certainly one of the most natural and wonderful mountains you could ever visit. One for the bucket list for sure.
 One of South Africa's most spectacular private game reserves
Sabi Sand Game Reserve is one of South Africa's most spectacular private game reserves. The chance that you see the entire Big Five is high in winter (June - August).