














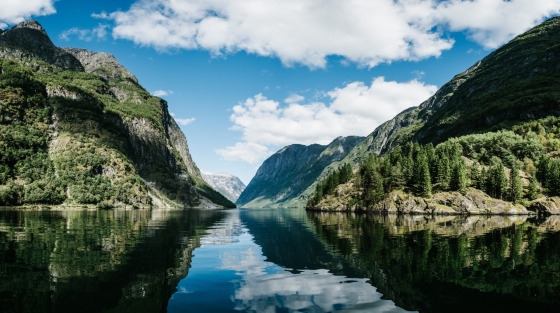
 The rugged landscape of the Norwegian fjords
This landscape is rated as the most beautiful in the world and it is something you need to experience at least once in your life.
August in Fjarland typically sees daytime highs of 16°C (61°F) and nighttime lows of 9°C (48°F). Rainfall is also possible this month, so it's worth packing an umbrella. It falls within the summer season.
So this is a great month to visit if you prefer dry days with pleasant temperatures.
 Min Temperature
Max Temperature
Min Temperature
Max Temperature
 Chance of Rain
Precipitation
Rainy days
Chance of Rain
Precipitation
Rainy days
Pick a month to see the average temperature, rainfall and sunshine in Fjarland - and find the best time to visit.
50-year average (1976-2025)
Based on our historical records, temperatures in Fjarland typically stay consistent throughout August, with daily highs averaging around 16°C (61°F). Nights are cool, with lows typically ranging from 7°C (45°F) to 10°C (50°F).
50-year average (1976-2025)
Average daily rainfall for each day of the month based on long-term records.
Browse day-by-day weather records for Fjarland spanning 51 years. Select any month and year to see actual temperatures, rainfall, and conditions recorded on each day.
Based on weather observations in Fjarland between 1976 and 2026, these are the recorded extremes during August.
Find out more about the weather in Norway and which places have the best travel conditions in this month. See all of Norway in August →
Perfect weather is subjective. On this map perfect weather has been defined with temperatures between 20°C (68°F) and 29°C (84°F) and not too much precipitation (less than 90 mm (3.5 in) a month).
The weather can be unpredictable in August, so pack clothes you can easily mix and match. You could bring jeans, other long pants, and a few t-shirts. A light jacket or light sweater will be pleasant for the cooler moments. Also bring a poncho, it will rain a lot! Waterproof everything you can.
We rated the following activities from 1 (least suitable) to 10 (best) to do.


See the full Fjarland climate overview or explore weather in Norway.
Where to go in August - average daytime high across popular destinations.
Need travel inspiration? Check out our bucket list articles and be inspired.
The rugged landscape of the Norwegian fjords
This landscape is rated as the most beautiful in the world and it is something you need to experience at least once in your life.
 Discover Norway's Hidden Gem: The Littleisland Lighthouse
Explore Littleisland Lighthouse in Norway - a serene getaway offering unique stays, breathtaking views, and a journey into tranquil simplicity.
 The Majestic Geirangerfjord: Norway's Crown Jewel
Explore Norway's stunning Geirangerfjord, famous for its dramatic cliffs, waterfalls, and scenic routes. Breathtaking landscapes and outdoor adventures
 Swimming with orcas in Norway
The best travel period to travel to Norway for the orcas are the months October, November December, January and February. Swimming with orcas in Norway might be the bucket list trip of your life.