















 The 10 most alternative cities in South America
Discover South America's top 10 alternative cities! From Valparaíso's vibrant streets to La Paz's high-altitude charm and Medellín's innovative spirit.
October in El Chaltén brings low temperatures, with daytime highs of 5°C (41°F) and nights around -2°C (28°F). It's part of the rainy season, with 191 mm (7.5 in) of snow/rainfall on average, so an umbrella or poncho is a good idea.
For additional travel inspiration, our weather planner can help you discover destinations worldwide.
 Min Temperature
Max Temperature
Min Temperature
Max Temperature
 Chance of Rain
Precipitation
Rainy days
Chance of Rain
Precipitation
Rainy days
 Sunshine
Percentage Sunshine
Sunshine
Percentage Sunshine
Pick a month to see the average temperature, rainfall and sunshine in El Chaltén - and find the best time to visit.
Browse day-by-day weather records for El Chaltén spanning 21 years. Select any month and year to see actual temperatures, rainfall, and conditions recorded on each day.
According to our 19 years of weather records for El Chaltén, the following extremes were recorded between 2006 and 2025.
Find out more about the weather in Argentina and which places have the best travel conditions in this month. See all of Argentina in October →
Perfect weather is subjective. On this map perfect weather has been defined with temperatures between 20°C (68°F) and 29°C (84°F) and not too much precipitation (less than 90 mm (3.5 in) a month).
Cold weather calls for smart layering in October. A thermal base layer makes a huge difference in staying warm. Add a wool sweater or fleece, then a wind-resistant outer jacket. Heavy rain is guaranteed, please bring a good poncho and waterproof everything! And with plenty of sunshine hours, don’t forget sunglasses, sunscreen, and maybe a sun hat.
We rated the following activities from 1 (least suitable) to 10 (best) to do.


See the full El Chaltén climate overview or explore weather in Argentina.
Where to go in October - average daytime high across popular destinations.
Córdoba 25°C (77°F) Mendoza
 24°C (75°F) Salta
 23°C (73°F) Villa Carlos Paz23°C (73°F) Buenos Aires23°C (73°F) Mar del Plata18°C (64°F) San Carlos de Bariloche11°C (52°F) San Martín de los Andes
 11°C (52°F)
 Need travel inspiration? Check out our bucket list articles and be inspired.
The 10 most alternative cities in South America
Discover South America's top 10 alternative cities! From Valparaíso's vibrant streets to La Paz's high-altitude charm and Medellín's innovative spirit.
 Warm Days, Cool Nights: 8 Destinations With the Perfect Day-Night Temperature
Prefer warm sunny days but cool evenings? Compare eight destinations with daytime temperatures of around 25–30°C, cooler nights, low rainfall and plenty of sunshine.
 Be amazed by Buenos Aires
The city of beautiful museums, cute streets, green parks, lots of good food, interesting local neighborhoods and impressive historical buildings.
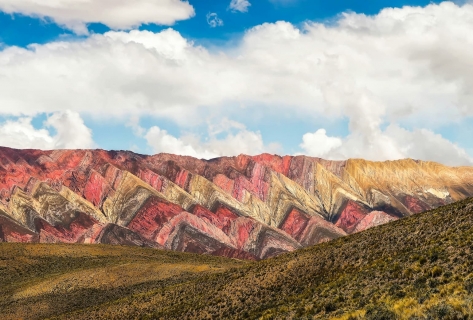 Argentina in November: Where to Go for the Best Weather
Compare November weather in Mendoza, Buenos Aires, Cafayate, Bariloche and Ushuaia to find Argentina's warmest, sunniest and driest places.