

















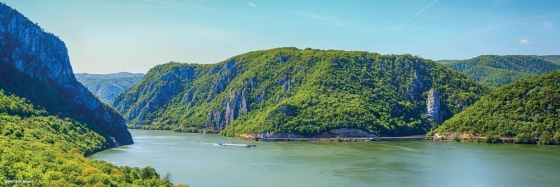
 Cycle the Danube trail
The Danube cycle route is one of the most popular cycling routes in Europe, and rightly so, because it is a varied route that is interesting both in terms of culture and nature.
March in Dolný Kubín brings low temperatures, with highs of 6°C (43°F) and nights dropping to -3°C (27°F). Rainfall is on the higher side this month, averaging around 79 mm (3.1 in), so keep a rain jacket handy.
March in Dolný Kubín has its charm. However, if you're seeking pleasant, dry and sunny weather, our weather planner can help you explore other destinations in the world.
 Min Temperature
Max Temperature
 Chance of Rain
Precipitation
Rainy days
 Humidity
 Sunshine
Percentage Sunshine
Pick a month to see the average temperature, rainfall and sunshine in Dolný Kubín - and find the best time to visit.
50-year average (1976-2025)
Based on our historical records, temperatures in Dolný Kubín typically rise from around 2°C (36°F) at the start of March to approximately 7°C (45°F) by the end. Nights are very cold, with lows typically ranging from -7°C (19°F) to -2°C (28°F).
50-year average (1976-2025)
Average daily rainfall for each day of the month based on long-term records.
Browse day-by-day weather records for Dolný Kubín spanning 51 years. Select any month and year to see actual temperatures, rainfall, and conditions recorded on each day.
Based on 50 years of weather observations (1976-2026), these are the most extreme conditions recorded in Dolný Kubín.
Find out more about the weather in Slovakia and which places have the best travel conditions in this month. See all of Slovakia in March →
Perfect weather is subjective. On this map perfect weather has been defined with temperatures between 20°C (68°F) and 29°C (84°F) and not too much precipitation (less than 90 mm (3.5 in) a month).
Dress warmly and in layers for your trip to Dolný Kubín in March. A good base layer system works wonders. Start with good thermal underwear, add something warm like a fleece sweater, then finish with a waterproof jacket on top. Wet weather is likely, so pack waterproof gear for multiple rainy days. Sunglasses could come in handy during the sunnier parts of your trip.
We rated the following activities from 1 (least suitable) to 10 (best) to do.


Temperature Rainfall Sunshine Humidity
See the full Dolný Kubín climate overview or explore weather in Slovakia.
Where to go in March - average daytime high across popular destinations.
 Bratislava
 11°C (52°F) Košice10°C (50°F) Donovaly
 7°C (45°F) Tatranská Lomnica6°C (43°F) Vysoké Tatry6°C (43°F) Bešeňová6°C (43°F) Demanovska Dolina6°C (43°F) Liptovský Mikuláš5°C (41°F)
Need travel inspiration? Check out our bucket list articles and be inspired.
Cycle the Danube trail
The Danube cycle route is one of the most popular cycling routes in Europe, and rightly so, because it is a varied route that is interesting both in terms of culture and nature.
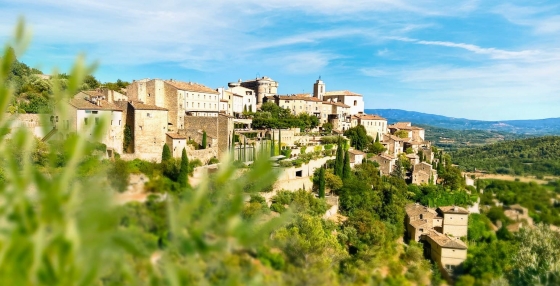
 The 10 most charming villages in France
Discover France's top 10 beautiful villages. From Normandy to the Côte d'Azur, experience quaint squares and cobbled streets. Which one will you visit this summer?

 The train journey from Bucharest to Brasov is one of the most beautiful in Romania
In three hours, you'll get from Bucharest to Brasov by train. It is one of the most beautiful routes in Romania, certainly the most beautiful that can be done by express train.
 An alternative way to discover Paris
From street art, vintage shops, vegetarian cafes, to amazing cultural events, Paris has much to offer for the creative traveler. An overview of sights that you must see if you want to visit this city in an alternative way.