
















 The world famous Victoria Falls in Zambia
The world famous Victoria Falls is one of the 7 natural wonders of the world for a reason. It is absolutely magnificent to see.
September in Chipata brings very high temperatures, with highs of 31°C (88°F) and nights dropping to 18°C (64°F). Rainfall is very low this month, averaging just 2.3 mm (0.1 in).
If you prefer dry days with pleasant temperatures, April, May, June, July and August typically offer the best circumstances. If you're seeking pleasant, dry and sunny weather somewhere else in the world, our weather planner can help you explore other options.
 Min Temperature
Max Temperature
 Chance of Rain
Precipitation
Rainy days
 Humidity
 Sunshine
Percentage Sunshine
Pick a month to see the average temperature, rainfall and sunshine in Chipata - and find the best time to visit.
Browse day-by-day weather records for Chipata spanning 51 years. Select any month and year to see actual temperatures, rainfall, and conditions recorded on each day.
Based on 20 years of weather observations (2006-2026), these are the most extreme conditions recorded in Chipata.
Find out more about the weather in Zambia and which places have the best travel conditions in this month. See all of Zambia in September →
Perfect weather is subjective. On this map perfect weather has been defined with temperatures between 20°C (68°F) and 29°C (84°F) and not too much precipitation (less than 90 mm (3.5 in) a month).
Warm but pleasant conditions in Chipata in September. Focus on lightweight, maybe with natural fabrics, cotton blend shirts, comfortable shorts, and breathable footwear. A light cover-up for sun protection is smart too. Dry conditions mean you won't need to worry about rain protection. Don't forget sun protection, sunglasses, sunscreen, and a hat. These are all good ideas with this much sunshine.
We rated the following activities from 1 (least suitable) to 10 (best) to do.


Temperature Rainfall Sunshine Humidity
See the full Chipata climate overview or explore weather in Zambia.
Where to go in September - average daytime high across popular destinations.
Livingstone 34°C (93°F) Chilanga31°C (88°F) Kitwe
 32°C (90°F) Chingola32°C (90°F) Shimwansa31°C (88°F) Lusaka31°C (88°F) Chelston31°C (88°F) Woodlands31°C (88°F)
Need travel inspiration? Check out our bucket list articles and be inspired.
The world famous Victoria Falls in Zambia
The world famous Victoria Falls is one of the 7 natural wonders of the world for a reason. It is absolutely magnificent to see.
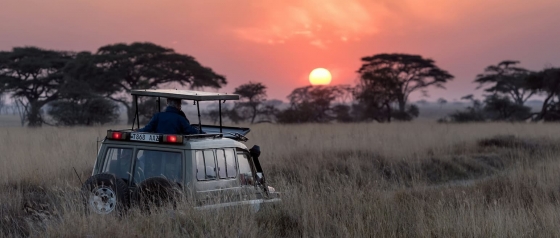
 5 Untouched Safari Destinations in Africa
Discover Africa's hidden national parks, from Zambia's Liuwa Plain to Zimbabwe's Matusadona, offering unique wildlife experiences off the beaten path.
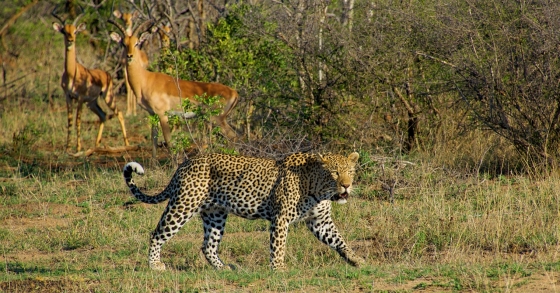
 Visit Kruger Park in South Africa
Are you going to South Africa, then you cannot skip the Kruger Park. The Kruger Park is one of the most beautiful and largest safari parks in the world.
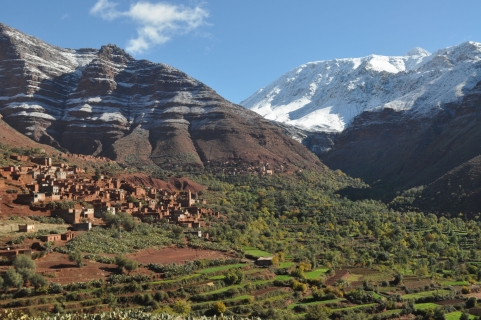
 The Atlas Mountains in Morocco
This mountain range is the second highest mountains in the world and is certainly one of the most natural and wonderful mountains you could ever visit. One for the bucket list for sure.