Average monthly water temperature in Sori, Italy
On this page you find the mean water temperature over the year in Sori (Liguria), Italy. Take a closer look at the water temperature patterns and what they mean for swimming and recreation.
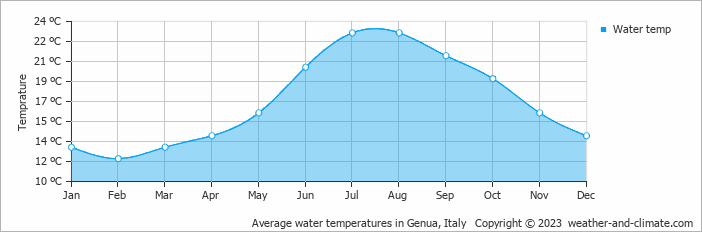
Data from: Genua, Italy (20 KM, 12 Miles).
Sori experiences water temperature shifts throughout the year. The warmest month, July, reaches an average of 23°C (73°F).
The coldest month, February, averages 12°C (54°F). Visitors during these months can leave their swimming gear at home.


