Climate ▸Forecast ▸February ▸March ▸
JanuaryFebruaryMarchAprilMayJuneJulyAugustSeptemberOctoberNovemberDecember

Average water temperature in Múggia

On this page you find the mean water temperature over the year in Múggia (Friuli Venezia Giulia), Italy. Discover when the water is at its warmest and coolest, perfect for planning your visit.

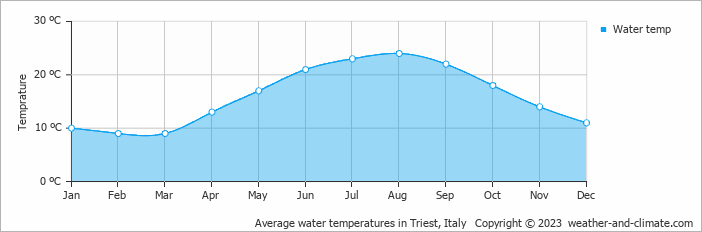
Data from: Triest, Italy (5 KM, 3 Miles).

In Múggia, water temperatures vary throughout the year. The warmest month is August, with an average water temperature of 24°C.

The coldest month is March, with an average temperature of 9°C. These seasonal variations make Múggia a great destination for different kinds of aquatic activities.


Forecast for Múggia

Friday
28 Feb
Partly cloudy
Partly cloudy
13°C
0.3 mm
Saturday
1 Mar
Cloudy
Cloudy
9°C
0 mm
Sunday
2 Mar
Clear sky
Clear sky
11°C
0 mm

Interested in more climate information?

This site provides you with all the information you need about the climate in Múggia.

Our site offers climate and forecast data for every country in the world. Are you going to Italy? On this website you can find historical weather averages for many cities in Italy. Not sure yet where to go? We now have a tool which recommends destinations that suit your ideal travel conditions. Find out where to go with our weather planner.

) ?>