Climate ▸Forecast ▸March ▸April ▸
JanuaryFebruaryMarchAprilMayJuneJulyAugustSeptemberOctoberNovemberDecember

Average water temperature in Gravina di Catania

On this page you find the mean water temperature over the year in Gravina di Catania (), Italy. Understand how water temperatures vary throughout the year.

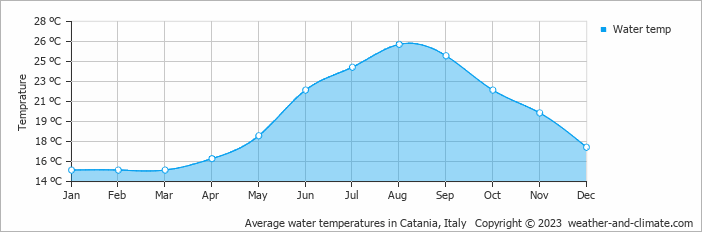
Data from: Catania, Italy (9 KM, 6 Miles).

Water temperatures in Gravina di Catania fluctuate across the seasons. The warmest month, August, averages 26°C.

The coldest water temperature month is March, averaging 15°C. Seasonal shifts offer opportunities to explore different activities depending on the time of year.


Forecast for Gravina di Catania

Thursday
13 Mar
Light rain showers
Light rain showers
18°C
1 mm
Friday
14 Mar
Partly cloudy
Partly cloudy
20°C
0 mm
Saturday
15 Mar
Fair
Fair
22°C
0 mm

Interested in more climate information?

This site provides you with all the information you need about the climate in Gravina di Catania.

Our site offers climate and forecast data for every country in the world. Are you going to Italy? On this website you can find historical weather averages for many cities in Italy. Not sure yet where to go? We now have a tool which recommends destinations that suit your ideal travel conditions. Find out where to go with our weather planner.

) ?>