Average monthly water temperature in Gabicce Mare, Italy
On this page you find the mean water temperature over the year in Gabicce Mare (Le Marche), Italy. Discover the unique water temperature patterns, from its warmest to its coolest months.
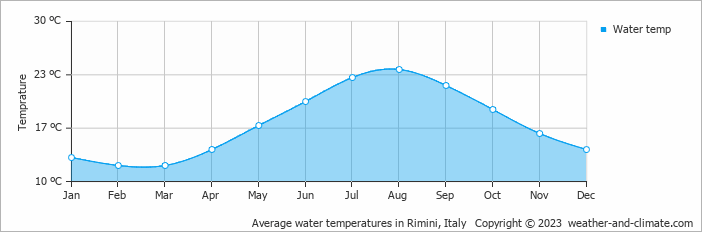
Data from: Rimini, Italy (11 KM, 7 Miles).
Gabicce Mare experiences water temperature shifts throughout the year. The warmest month, August, reaches an average of 24°C (75°F).
The coldest month, March, averages 12°C (54°F). Visitors during these months can leave their swimming gear at home.


