Climate ▸Forecast ▸March ▸April ▸
JanuaryFebruaryMarchAprilMayJuneJulyAugustSeptemberOctoberNovemberDecember

Average water temperature in Catona

On this page you find the mean water temperature over the year in Catona (Calabria), Italy. Dive into the water temperature trends, highlighting the best times for swimming and other activities.

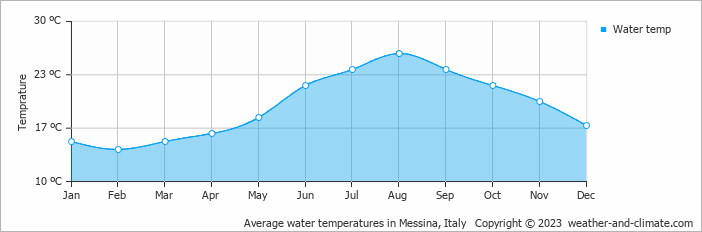
Data from: Messina, Italy (7 KM, 4 Miles).

Water temperatures in Catona fluctuate across the seasons. The warmest month, August, averages 26°C.

The coldest water temperature month is February, averaging 14°C. Seasonal shifts offer opportunities to explore different activities depending on the time of year.


Forecast for Catona

Sunday
9 Mar
Fair
Fair
17°C
0 mm
Monday
10 Mar
Partly cloudy
Partly cloudy
18°C
0 mm
Tuesday
11 Mar
Light rain showers
Light rain showers
20°C
1.1 mm

Interested in more climate information?

This site provides you with all the information you need about the climate in Catona.

Our site offers climate and forecast data for every country in the world. Are you going to Italy? On this website you can find historical weather averages for many cities in Italy. Not sure yet where to go? We now have a tool which recommends destinations that suit your ideal travel conditions. Find out where to go with our weather planner.

) ?>