Climate ▸Forecast ▸February ▸March ▸
JanuaryFebruaryMarchAprilMayJuneJulyAugustSeptemberOctoberNovemberDecember

Average water temperature in Puerto Cabezas

On this page you find the mean water temperature over the year in Puerto Cabezas (), Nicaragua. Understand how water temperatures vary throughout the year.

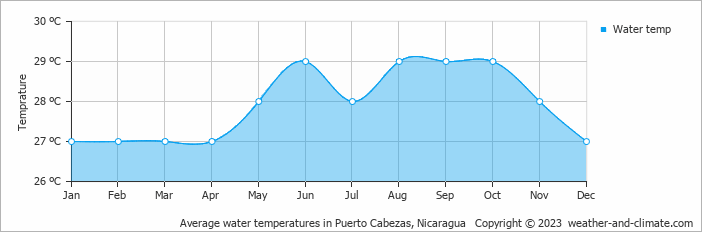
In Puerto Cabezas, water temperatures are consistently warm throughout the year. The warmest month is September, with an average water temperature of 29°C.

The coolest month is January, with an average temperature of 27°C. This makes Puerto Cabezas a year-round destination for swimming and other water-based activities.


Forecast for Puerto Cabezas

Thursday
13 Feb
Light rain showers
Light rain showers
29°C
3.2 mm
Friday
14 Feb
Light rain showers
Light rain showers
28°C
1.3 mm
Saturday
15 Feb
Light rain showers
Light rain showers
28°C
1.3 mm

Interested in more climate information?

This site provides you with all the information you need about the climate in Puerto Cabezas.

Our site offers climate and forecast data for every country in the world. Are you going to Nicaragua? On this website you can find historical weather averages for many cities in Nicaragua. Not sure yet where to go? We now have a tool which recommends destinations that suit your ideal travel conditions. Find out where to go with our weather planner.

) ?>