Arauco Precipitation: Average Monthly Rainfall and Snowfall
This graph shows the average amount of rainfall per month in Arauco (). The numbers are calculated over a 30-year period to provide a reliable average.
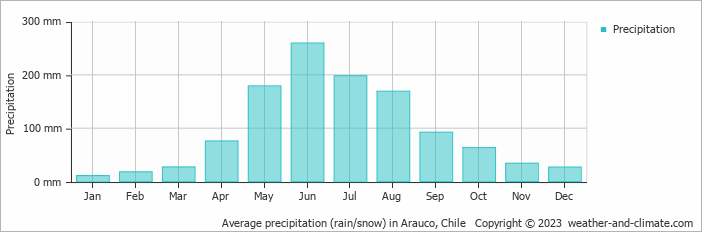
- A lot of rain (rainy season) falls in the months: May, June, July and August.
- Arauco has dry periods in January and February.
- On average, June is the wettest month with 259 mm of precipitation.
- On average, January is the driest month with 11 mm of precipitation.
- The average amount of annual precipitation is 1153 mm.
Current rainfall in Arauco
Tue Oct 22
16°C | 9°C
NE  11 km/h
11 km/hpartly cloudy and no rain
Wed Oct 23
15°C | 12°C
N 18 km/h
18 km/h1.1 mm
overcast and chance of rain
Thu Oct 24
15°C | 10°C
SW 22 km/h
22 km/h4.5 mm
overcast and small chance of rain