Rockaway Beach (OR) Monthly Rainfall & Precipitation
This page shows both the average monthly rainfall and the number of rainy days in Rockaway Beach, Oregon, United States of America. This average is based on long-term data collected between 1990 and 2020. Let's now guide you through the details for a complete overview.
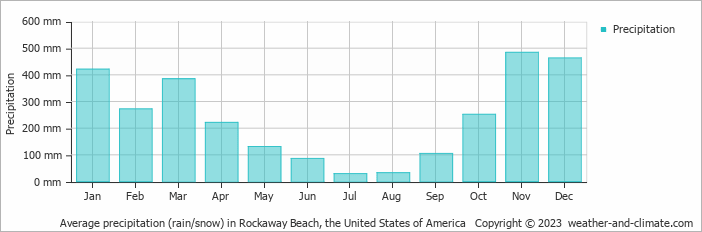
Rockaway Beach is known for its substantial rain/snowfall, with annual precipitation reaching 2879 mm (113 in). While the overall climate is wet, there are notable seasonal patterns that create interesting contrasts, as demonstrated in our graph below.
Monthly Precipitation Levels
The average number of days each month with precipitation (> 0.2 mm (0.01 in))
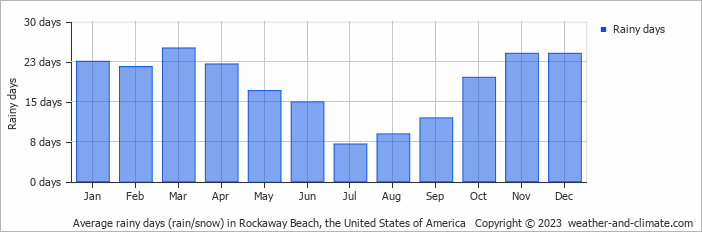
The seasons in Rockaway Beach, bring significant changes in precipitation. The wettest month, November, receives heavy rainfall, with an average of 484 mm (19 in) of precipitation. This rainfall is distributed across 24 rainy days.
In contrast, the driest month, July, experiences much less rainfall, totaling 29 mm (1.1 in) over 7 rainy days. These distinct seasonal differences provide diverse experiences throughout the year.November, the wettest month, has a maximum daytime temperature of 11°C (52°F). The city receives 81 hours of sunshine in this period. During the driest month July you can expect a temperature of 21°C (70°F). For more detailed insights into the city's temperatures, visit our Rockaway Beach Temperature page.
Annual Rainfall in the United States of America: City Comparison
The map below shows the annual precipitation across the United States of America. You can also select the different months in case you are interested in a specific month.
 heavy rainfall
 high
high
 moderate
 low
low
 almost none
Rockaway Beach vs World: Rainfall Compared
Rockaway Beach's average annual precipitation is 2879 mm (113 in). Let's compare this to some popular worldwide tourist destinations:
Chicago, USA, sees an annual precipitation of 1062 mm (42 in), with rain and snow contributing to its humid climate.
In Seoul, South Korea, the average annual precipitation is 1237 mm (49 in), with most rain falling during the summer monsoon season.
Perth, Australia, receives 565 mm (22 in) of rainfall annually, mostly during the winter months.
Kuala Lumpur, Malaysia, receives 2529 mm (100 in) of annual rainfall, characteristic of its equatorial tropical rainforest climate, with consistent rainfall throughout the year and peak months during March and November.
Precipitation amounts are measured using specific gauges installed at weather stations, collecting both rain and snow and any other type of precipitation. Rainfall is measured directly in millimeters, while that from snow and ice is obtained by melting it. Automated systems often incorporate heaters to make this easier.
Information from these stations is transmitted via Wi-Fi, satellite, GPS, or telephone connections to central monitoring networks. This information is immediately updated and integrated into weather models and forecasts.
- "Ginger" was the longest-lasting Atlantic tropical storm, which spun around the open ocean for 28 days in 1971.
- The world's largest snowflake was recorded in the Guinness Book of Records, at 38 cm (15 inches) wide and 20 cm (7.9 inches) thick. The snowflake fell at Fort Keogh, Montana, USA, on 28 January 1887.
- The greatest snowfall recorded was on Mt. Rainier, Washington State, USA—over 31.5 meters (103 feet) fell during the winter of 1972.
For more detailed information about Rockaway Beach (OR)'s weather, including sunshine hours, humidity levels, and temperature data, visit our Rockaway Beach (OR) Climate page.


