















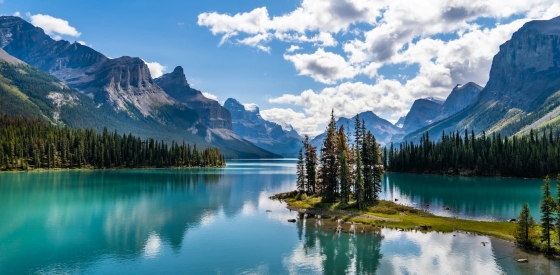
 The 5 most beautiful lakes in Canada
Explore Canada's stunning lakes: Lake Louise, Lake Superior, Maligne Lake, Emerald Lake, and Lake Okanagan, each offering unique beauty and activities.
This page shows both the average monthly rainfall and the number of rainy days in Pointe-Noire, Basse-Terre, Guadeloupe. These averages rely on historical data collected over 30 years, from 1990 to 2020. Let's explore the details to provide you with a complete overview.
Generally, Pointe-Noire has a moderate amount of precipitation, averaging 789 mm (31 in) of rainfall annually. However, it does experience a distinct dry season during certain months. Take a look at our detailed charts below to see the seasonal variation.
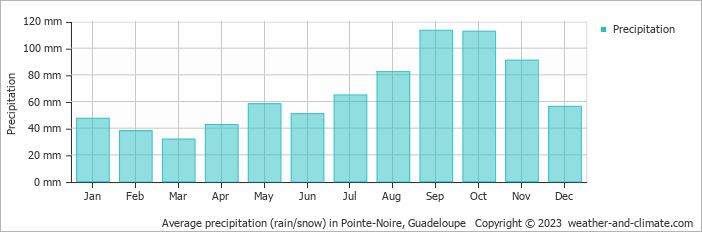
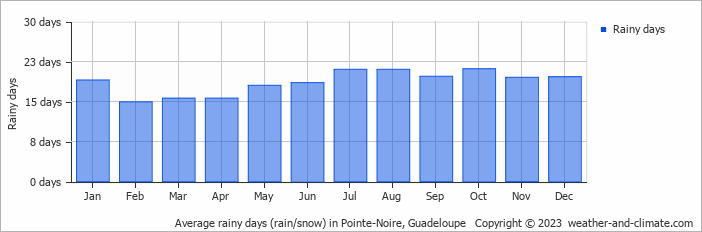
Significant seasonal changes in precipitation occur throughout the year. During the wettest month, September receives substantial rainfall, averaging 113 mm (4.4 in) of precipitation, recorded across 20 rainy days.
In contrast, the driest month, March brings less rainfall, with 32 mm (1.3 in) over 16 rainy days.
September, the wettest month, has a maximum daytime temperature of 30°C (86°F). The city receives 218 hours of sunshine in this period. During the driest month March you can expect a temperature of 27°C (81°F). For more detailed insights into the city's temperatures, visit our Pointe-Noire Temperature page.
Browse day-by-day precipitation records for Pointe-Noire spanning 51 years. Select any month and year to see actual rainfall and snowfall recorded on each day.
The map below shows the annual precipitation across Guadeloupe. You can also select the different months in case you are interested in a specific month.
Pointe-Noire's average annual precipitation is 789 mm (31 in). Let's compare this to some popular worldwide tourist destinations:
In Barcelona, Spain, the average annual precipitation is 644 mm (25 in), evenly distributed across the year with no extreme wet or dry seasons.
Osaka, Japan, experiences 1507 mm (59 in) of rainfall annually, spread across the year with wetter summers.
Perth, Australia, receives 565 mm (22 in) of rainfall annually, mostly during the winter months.
Singapore, situated near the equator, gets 2581 mm (102 in) of rainfall annually, with no distinct dry season and consistent monthly precipitation.
Precipitation amounts are measured using specific gauges installed at weather stations, collecting both rain and snow and any other type of precipitation. Rainfall is measured directly in millimeters, while that from snow and ice is obtained by melting it. Automated systems often incorporate heaters to make this easier.
Information from these stations is transmitted via Wi-Fi, satellite, GPS, or telephone connections to central monitoring networks. This information is immediately updated and integrated into weather models and forecasts.
The proximity of a location to a large body of water can significantly affect its rainfall patterns:
For more detailed information about Pointe-Noire's weather, including sunshine hours, humidity levels, and temperature data, visit our Pointe-Noire Climate page.
Pick a month to see the average temperature, rainfall and sunshine in Pointe-Noire - and find the best time to visit.
Temperature Rainfall Sunshine Humidity
See the full Pointe-Noire climate overview or explore weather in Guadeloupe.
Where to go in September - average daytime high across popular destinations.
 Bouillante
 30°C (86°F) Sainte-Rose
 30°C (86°F) Capesterre-Belle-Eau29°C (84°F) Le Moule
 29°C (84°F) Deshaies30°C (86°F) Sainte-Anne29°C (84°F) Le Gosier29°C (84°F) Saint-François29°C (84°F)
 Need travel inspiration? Check out our bucket list articles and be inspired.
The 5 most beautiful lakes in Canada
Explore Canada's stunning lakes: Lake Louise, Lake Superior, Maligne Lake, Emerald Lake, and Lake Okanagan, each offering unique beauty and activities.
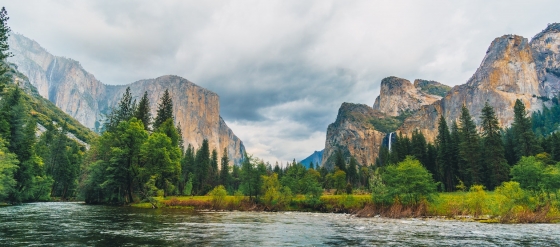
 Yosemite National Park is definitely worth a visit
Vast forests, blue lakes, towering sequoias, and majestic waterfalls hint at the beauty of Yosemite National Park—a true natural masterpiece.
 The 10 most alternative cities in the United States
Discover the top 10 fun and alternative U.S. cities rich in art, culture, and adventure. From Portland's hippy charm to Sedona's stunning landscapes.

 Lake Atitlan: the most beautiful lake in the world
At Lake Atitlan you will be enchanted by beautiful volcanoes, amazing sunsets and the serene tranquility. Mix this with the vibrant Mayan community and you'll understand why Atitlan has something magical.