Playas Doradas Monthly Rainfall & Precipitation
This page shows both the average monthly rainfall and the number of rainy days in Playas Doradas, Argentina. Long-term data from 1990 to 2020 was used to calculate these averages. Let's now guide you through the details for a complete overview.
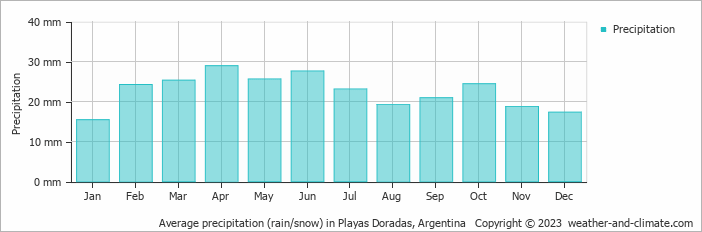
Playas Doradas typically sees modest rainfall throughout the year, with an average annual precipitation of 271 mm (11 in). The city experiences a distinct dry season during certain months, as illustrated in the graph below.
Monthly Precipitation Levels
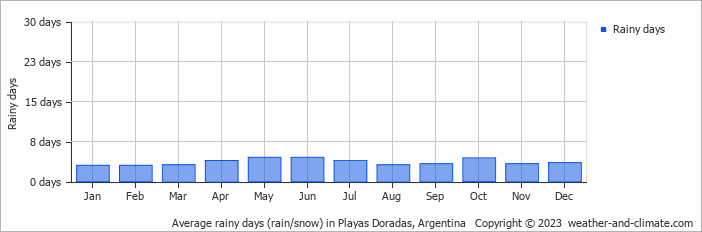
The average number of days each month with precipitation (> 0.2 mm (0.01 in))
The amount of precipitation varies moderately throughout the year. The wettest month, April, sees around 29 mm (1.1 in) of rainfall, perfect for those who enjoy a bit of rain now and then. The driest month, January, still receives a respectable 15 mm (0.6 in) of rainfall.
April, the wettest month, has a maximum daytime temperature of 21°C (70°F). During the driest month January you can expect a temperature of 27°C (81°F). For more detailed insights into the city's temperatures, visit our Playas Doradas Temperature page.
Annual Rainfall in Argentina: City Comparison
The map below shows the annual precipitation across Argentina. You can also select the different months in case you are interested in a specific month.
 heavy rainfall
 high
high
 moderate
 low
low
 almost none
Playas Doradas vs World: Rainfall Compared
Playas Doradas's average annual precipitation is 271 mm (11 in). Let's compare this to some popular worldwide tourist destinations:
New York City, USA, receives 1276 mm (50 in) of rainfall annually, with precipitation evenly distributed throughout the year.
In Shanghai, China, the annual average precipitation is 1347 mm (53 in), with a humid subtropical climate.
Perth, Australia, receives 565 mm (22 in) of rainfall annually, mostly during the winter months.
Ho Chi Minh City, Vietnam, receives 1955 mm (77 in) of annual rainfall, with a pronounced wet season from May to November, typical of its tropical monsoon climate.
Precipitation amounts are measured using specific gauges installed at weather stations, collecting both rain and snow and any other type of precipitation. Rainfall is measured directly in millimeters, while that from snow and ice is obtained by melting it. Automated systems often incorporate heaters to make this easier.
Information from these stations is transmitted via Wi-Fi, satellite, GPS, or telephone connections to central monitoring networks. This information is immediately updated and integrated into weather models and forecasts.
- The U.S. has a significant number of thunderstorms every year, with over 14.6 million taking place across the world annually.
- Approximately 70% of lightning bolts strike land rather than oceans.
- A storm named John was the longest-lasting Pacific tropical storm, continuing for 31 days. As it crossed the dateline twice, it changed status from a hurricane to a typhoon and back to a hurricane.
For more detailed information about Playas Doradas's weather, including sunshine hours, humidity levels, and temperature data, visit our Playas Doradas Climate page.


