Peoria (AZ) Monthly Rainfall & Precipitation
This page shows both the average monthly rainfall and the number of rainy days in Peoria, Arizona, United States of America. This average is based on long-term data collected between 1990 and 2020. Let's now guide you through the details for a complete overview.
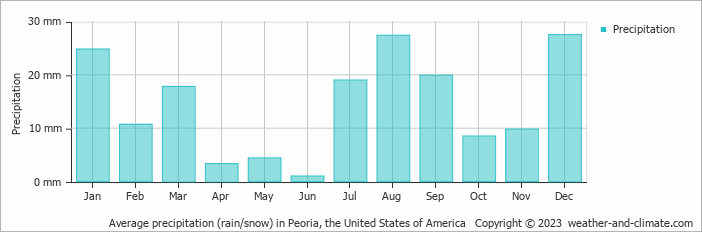
Peoria experiences desert-like conditions in terms of precipitation with almost no rainfall, generally receiving 174 mm (6.9 in) annually.
Monthly Precipitation Levels
The average number of days each month with precipitation (> 0.2 mm (0.01 in))
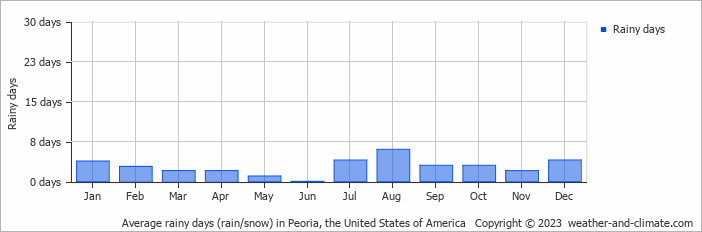
The climate in Peoria shows significant variation throughout the year. Expect 28 mm (1.1 in) of precipitation during the wettest month December, distributed over 4 rainy days.
In contrast, June offers drier and sunnier days, with around 1 mm (0.04 in) of rainfall over 0 rainy days.
December, the wettest month, has a maximum daytime temperature of 18°C (64°F). The city receives 244 hours of sunshine in this period. During the driest month June you can expect a temperature of 40°C (104°F). For more detailed insights into the city's temperatures, visit our Peoria Temperature page.
Annual Rainfall in the United States of America: City Comparison
The map below shows the annual precipitation across the United States of America. You can also select the different months in case you are interested in a specific month.
 heavy rainfall
 high
high
 moderate
 low
low
 almost none
Peoria vs World: Rainfall Compared
Peoria's average annual precipitation is 174 mm (6.9 in). Let's compare this to some popular worldwide tourist destinations:
In Barcelona, Spain, the average annual precipitation is 620 mm (24 in), evenly distributed across the year with no extreme wet or dry seasons.
Beijing, China, receives 560 mm (22 in) of annual precipitation, concentrated in the summer months.
Adelaide, Australia, enjoys 511 mm (20 in) of annual precipitation, with dry summers and wet winters.
Singapore, situated near the equator, gets 2581 mm (102 in) of rainfall annually, with no distinct dry season and consistent monthly precipitation.
Precipitation amounts are measured using specific gauges installed at weather stations, collecting both rain and snow and any other type of precipitation. Rainfall is measured directly in millimeters, while that from snow and ice is obtained by melting it. Automated systems often incorporate heaters to make this easier.
Information from these stations is transmitted via Wi-Fi, satellite, GPS, or telephone connections to central monitoring networks. This information is immediately updated and integrated into weather models and forecasts.
- Mawsynram in India is noted as being the wettest place on earth, with over 11 meters (36 feet) of rain falling every year.
- In contrast, Antofagasta in Chile is among the driest places on the planet, getting less than 0.1mm (0.004 inches) per year, with some years recording virtually no rainfall.
- Nearly 1,650 thunderstorm cells are estimated over the planet at any given time.
For more detailed information about Peoria (AZ)'s weather, including sunshine hours, humidity levels, and temperature data, visit our Peoria (AZ) Climate page.