Las Grutas Monthly Rainfall & Precipitation
This page shows both the average monthly rainfall and the number of rainy days in Las Grutas, Río Negro, Argentina. Long-term data from 1990 to 2020 was used to calculate these averages. Now, let's explore all the details to give you a full picture.
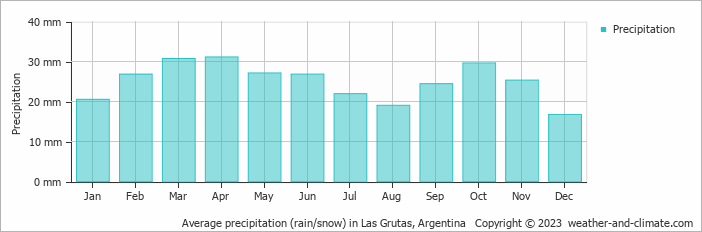
Las Grutas has a relatively dry climate with low precipitation, averaging 300 mm (12 in) of rainfall annually. It experiences a distinct dry season during certain months. Refer to our detailed charts below to see the seasonal variation.
Monthly Precipitation Levels
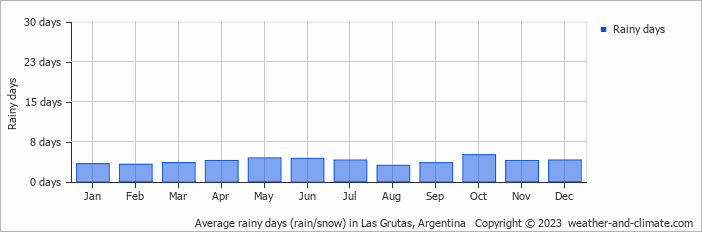
The average number of days each month with precipitation (> 0.2 mm (0.01 in))
The amount of precipitation varies moderately throughout the year. The wettest month, April, sees around 31 mm (1.2 in) of rainfall, perfect for those who enjoy a bit of rain now and then. The driest month, December, still receives a respectable 17 mm (0.7 in) of rainfall.
April, the wettest month, has a maximum daytime temperature of 22°C (72°F). During the driest month December you can expect a temperature of 28°C (82°F). For more detailed insights into the city's temperatures, visit our Las Grutas Temperature page.
Daily Historical Precipitation
49-year average (1976-2025)
Average daily rainfall for each day of the month based on long-term records.
Average precipitation in July
Explore Las Grutas's Historical Precipitation: 1976-2026
Browse day-by-day precipitation records for Las Grutas spanning 51 years. Select any month and year to see actual rainfall and snowfall recorded on each day.
Annual Rainfall in Argentina: City Comparison
The map below shows the annual precipitation across Argentina. You can also select the different months in case you are interested in a specific month.
 heavy rainfall
 high
high
 moderate
 low
low
 almost none
Las Grutas vs World: Rainfall Compared
Las Grutas's average annual precipitation is 300 mm (12 in). Let's compare this to some popular worldwide tourist destinations:
Seville, Spain, experiences 541 mm (21 in) of rainfall annually, with wet winters and dry summers typical of southern Spain.
Meanwhile, Buenos Aires, Argentina, enjoys a humid subtropical climate with 1000 mm (39 in) of annual rainfall, mostly in the summer.
Melbourne, Australia, has 690 mm (27 in) of rainfall annually, spread fairly evenly throughout the year.
Singapore, situated near the equator, gets 2581 mm (102 in) of rainfall annually, with no distinct dry season and consistent monthly precipitation.
Precipitation amounts are measured using specific gauges installed at weather stations, collecting both rain and snow and any other type of precipitation. Rainfall is measured directly in millimeters, while that from snow and ice is obtained by melting it. Automated systems often incorporate heaters to make this easier.
Information from these stations is transmitted via Wi-Fi, satellite, GPS, or telephone connections to central monitoring networks. This information is immediately updated and integrated into weather models and forecasts.
- "Ginger" was the longest-lasting Atlantic tropical storm, which spun around the open ocean for 28 days in 1971.
- The world's largest snowflake was recorded in the Guinness Book of Records, at 38 cm (15 inches) wide and 20 cm (7.9 inches) thick. The snowflake fell at Fort Keogh, Montana, USA, on 28 January 1887.
- The greatest snowfall recorded was on Mt. Rainier, Washington State, USA—over 31.5 meters (103 feet) fell during the winter of 1972.
For more detailed information about Las Grutas's weather, including sunshine hours, humidity levels, and temperature data, visit our Las Grutas Climate page.


