Jinzhou Monthly Rainfall & Precipitation
This page shows both the average monthly rainfall and the number of rainy days in Jinzhou, China. This average is based on long-term data collected between 1990 and 2020. Let's now guide you through the details for a complete overview.
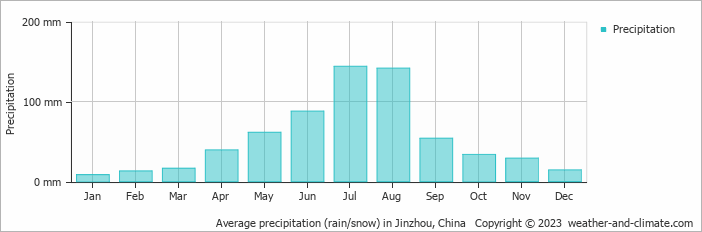
Generally, Jinzhou receives mid-range precipitation levels, with 642 mm (25 in) annually. The distribution varies significantly throughout the year, with a distinct dry season during certain months, as shown in our charts below.
Monthly Rainfall & Rainy Days
Monthly Precipitation Levels
The average number of days each month with precipitation (> 0.2 mm (0.01 in))
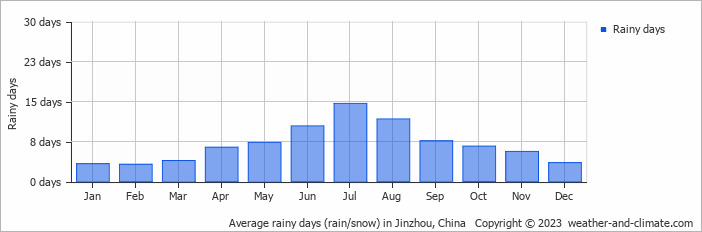
Jinzhou can be quite wet during July, receiving approximately 144 mm (5.7 in) of precipitation over 15 rainy days.
In contrast January, experiences much drier conditions, with 8.3 mm (0.3 in) of snowfall, spread across 3 snowy days.
July, the wettest month, has a maximum daytime temperature of 27°C (81°F). The city receives 231 hours of sunshine in this period. During the driest month January you can expect a temperature of 1°C (34°F). For more detailed insights into the city's temperatures, visit our Jinzhou Temperature page.
Daily Historical Precipitation
Average daily rainfall for each day of the month based on long-term records. 50-year average (1976-2025)
Average precipitation in July
Explore Jinzhou's Historical Precipitation: 1976-2026
Browse day-by-day precipitation records for Jinzhou spanning 51 years. Select any month and year to see actual rainfall and snowfall recorded on each day.
Annual Rainfall in China: City Comparison
The map below shows the annual precipitation across China. You can also select the different months in case you are interested in a specific month.
Jinzhou vs World: Rainfall Compared
Jinzhou's average annual precipitation is 642 mm (25 in). Let's compare this to some popular worldwide tourist destinations:
Chicago, USA, sees an annual precipitation of 1062 mm (42 in), with rain and snow contributing to its humid climate.
Osaka, Japan, experiences 1507 mm (59 in) of rainfall annually, spread across the year with wetter summers.
Melbourne, Australia, has 690 mm (27 in) of rainfall annually, spread fairly evenly throughout the year.
Ho Chi Minh City, Vietnam, receives 1955 mm (77 in) of annual rainfall, with a pronounced wet season from May to November, typical of its tropical monsoon climate.
Precipitation amounts are measured using specific gauges installed at weather stations, collecting both rain and snow and any other type of precipitation. Rainfall is measured directly in millimeters, while that from snow and ice is obtained by melting it. Automated systems often incorporate heaters to make this easier.
Information from these stations is transmitted via Wi-Fi, satellite, GPS, or telephone connections to central monitoring networks. This information is immediately updated and integrated into weather models and forecasts.
Climate change is affecting precipitation patterns worldwide, including Jinzhou:
- Changing Rainfall Patterns: Global warming causes drastic changes in the patterns of rainfall. Some areas have been experiencing increased frequency and intensity of rainfall, while other areas experience longer dry spells or even droughts.
- Local Impacts: Many regions are experiencing heavier rainfall in the winter months and drier, hotter summers. This affects agriculture, water resources, and ecosystems.
- Mawsynram in India is noted as being the wettest place on earth, with over 11 meters (36 feet) of rain falling every year.
- In contrast, Antofagasta in Chile is among the driest places on the planet, getting less than 0.1mm (0.004 inches) per year, with some years recording virtually no rainfall.
- Nearly 1,650 thunderstorm cells are estimated over the planet at any given time.
For more detailed information about Jinzhou's weather, including sunshine hours, humidity levels, and temperature data, visit our Jinzhou Climate page.
Jinzhou Weather by Month
Pick a month to see the average temperature, rainfall and sunshine in Jinzhou - and find the best time to visit.
Jinzhou 3-Day Forecast
Temperature Rainfall Sunshine Humidity Wind Speed Water Temp
See the full Jinzhou climate overview or explore weather in China.
Popular this month
Where to go in July - average daytime high across popular destinations.
Bucket list
Need travel inspiration? Check out our bucket list articles and be inspired.
 The Li River: A Journey Through China’s Most Breathtaking Landscape
Explore the Li River, China's breathtaking landscape with majestic mountains, serene waters, and picturesque views. A must-see for every traveler.
Go to China's Zhangjiajie National Park with the highest, the fastest, largest-loaded outdoor elevator in the world
You won't find this unique landscape anywhere else in the world. Thousands of floating mountains overgrown with trees at the top dominate this fairy tale landscape.
Go to Xinjiang in China
In Xinjiang you get to see a mix of East and Central Asia. An experience that you might want to add to your bucket list. You can travel through the province as if you are following an ancient silk route.
Mount Kailash
The best time for a Kailash tour/trekking is from mid-May to mid-October when the temperature is most pleasant. It is warm, dry and sunny in that period.