Fabuaeran Monthly Rainfall & Precipitation
This page shows both the average monthly rainfall and the number of rainy days in Fabuaeran, Line Islands. Long-term data from 1990 to 2020 was used to calculate these averages. Now, let's break down all the details for a clearer picture.
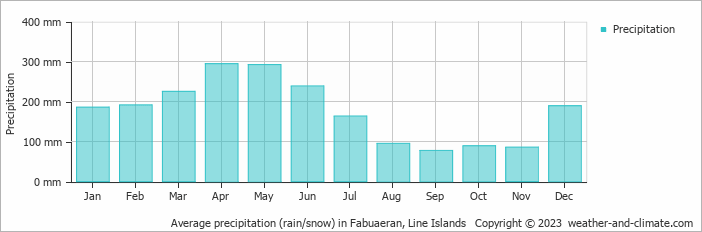
Fabuaeran experiences significant rainfall throughout the year, averaging 2125 mm (84 in) of precipitation annually. However, this abundant rainfall is not evenly distributed, with a distinct rainy season during certain months. You can clearly see this in our monthly precipitation graphs below.
Monthly Rainfall & Rainy Days
Monthly Precipitation Levels
The average number of days each month with precipitation (> 0.2 mm (0.01 in))
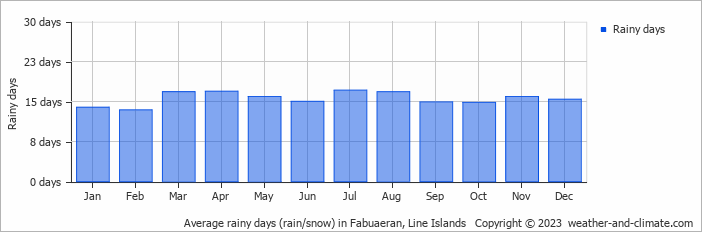
Fabuaeran can be quite wet during April, receiving approximately 294 mm (12 in) of precipitation over 17 rainy days.
In contrast September, experiences much drier conditions, with 77 mm (3 in) of rainfall, spread across 15 rainy days.
April, the wettest month, has a maximum daytime temperature of 29°C (84°F). During the driest month September you can expect a temperature of 29°C (84°F). For more detailed insights into the city's temperatures, visit our Fabuaeran Temperature page.
Explore Fabuaeran's Historical Precipitation: 1976-2026
Browse day-by-day precipitation records for Fabuaeran spanning 51 years. Select any month and year to see actual rainfall and snowfall recorded on each day.
Annual Rainfall in Line Islands: City Comparison
The map below shows the annual precipitation across Line Islands. You can also select the different months in case you are interested in a specific month.
Fabuaeran vs World: Rainfall Compared
Fabuaeran's average annual precipitation is 2125 mm (84 in). Let's compare this to some popular worldwide tourist destinations:
In Lisbon, Portugal, the average annual precipitation is 774 mm (30 in), characterized by wet winters and dry summers typical of the Mediterranean climate.
Beijing, China, receives 560 mm (22 in) of annual precipitation, concentrated in the summer months.
Melbourne, Australia, has 690 mm (27 in) of rainfall annually, spread fairly evenly throughout the year.
Ho Chi Minh City, Vietnam, receives 1955 mm (77 in) of annual rainfall, with a pronounced wet season from May to November, typical of its tropical monsoon climate.
Precipitation amounts are measured using specific gauges installed at weather stations, collecting both rain and snow and any other type of precipitation. Rainfall is measured directly in millimeters, while that from snow and ice is obtained by melting it. Automated systems often incorporate heaters to make this easier.
Information from these stations is transmitted via Wi-Fi, satellite, GPS, or telephone connections to central monitoring networks. This information is immediately updated and integrated into weather models and forecasts.
- Mawsynram in India is noted as being the wettest place on earth, with over 11 meters (36 feet) of rain falling every year.
- In contrast, Antofagasta in Chile is among the driest places on the planet, getting less than 0.1mm (0.004 inches) per year, with some years recording virtually no rainfall.
- Nearly 1,650 thunderstorm cells are estimated over the planet at any given time.
For more detailed information about Fabuaeran's weather, including sunshine hours, humidity levels, and temperature data, visit our Fabuaeran Climate page.
Fabuaeran Weather by Month
Pick a month to see the average temperature, rainfall and sunshine in Fabuaeran - and find the best time to visit.
Fabuaeran 3-Day Forecast
Temperature Rainfall Humidity Wind Speed Water Temp
See the full Fabuaeran climate overview or explore weather in Line Islands.
Popular this month
Where to go in July - average daytime high across popular destinations.